Tangent and Cotangent Graphs
520 likes | 790 Views
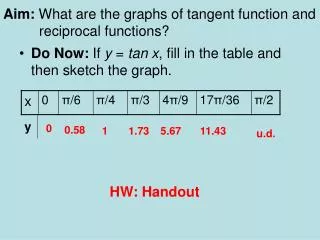
Tangent and Cotangent Graphs. Reading and Drawing Tangent and Cotangent Graphs. Some slides in this presentation contain animation. Slides will be more meaningful if you allow each slide to finish its presentation before moving to the next one. This is the graph for y = tan x.

Tangent and Cotangent Graphs
E N D
Presentation Transcript
Tangent and Cotangent Graphs Reading and Drawing Tangent and Cotangent Graphs Some slides in this presentation contain animation. Slides will be more meaningful if you allow each slide to finish its presentation before moving to the next one.
This is the graph for y = tan x. This is the graph for y = cot x.
This is the graph for y = cos x. One definition for tangent is . Notice that the denominator is cos x. This indicates a relationship between a tangent graph and a cosine graph.
To see how the cosine and tangent graphs are related, look at what happens when the graph for y = tan x is superimposed over y = cos x.
In the diagram below, y = cos x is drawn in gray while y = tan x is drawn in black. Notice that the tangent graph has horizontal asymptotes (indicated by broken lines) everywhere the cosine graph touches the x-axis.
One definition for cotangent is . Notice that the denominator is sin x. This indicates a relationship between a cotangent graph and a sine graph. This is the graph for y = sin x.
To see how the sine and cotangent graphs are related, look at what happens when the graph for y = cot x is superimposed over y = sin x.
In the diagram below, y = sin x is drawn in gray while y = cot x is drawn in black. Notice that the cotangent graph has horizontal asymptotes (indicated by broken lines) everywhere the sine graph touches the x-axis.
y = tan x. y = cot x. For tangent and cotangent graphs, the distance between any two consecutive vertical asymptotes represents one complete period.
y = tan x. One complete period is highlighted on each of these graphs. y = cot x. For both y = tan x and y = cot x, the period is π. (From the beginning of a cycle to the end of that cycle, the distance along the x-axis is π.)
For y = tan x, there is no phase shift. The y-intercept is located at the point (0,0). We will call that point, the key point.
A tangent graph has a phase shift if the key point is shifted to the left or to the right.
For y = cot x, there is no phase shift. Y = cot x has a vertical asymptote located along the y-axis. We will call that asymptote, the key asymptote.
A cotangent graph has a phase shift if the key asymptote is shifted to the left or to the right.
For a cotangent graph which has no vertical shift, the equation for the graph can be written as For a tangent graph which has no vertical shift, the equation for the graph can be written as y = a tan b (x - c). y = a cot b (x - c). a indicates whether the graph reflects about the x-axis. c indicates the phase shift, also known as the horizontal shift. b affects the period.
Unlike sine or cosine graphs, tangent and cotangent graphs have no maximum or minimum values. Their range is (-∞, ∞), so amplitude is not defined. However, it is important to determine whether a is positive or negative. When a is negative, the tangent or cotangent graph will “flip” or reflect about the x-axis. y = a tan b (x - c) y = a cot b (x - c)
Notice the behavior of y = tan x. Notice what happens to each section of the graph as it nears its asymptotes. As each section nears the asymptote on its left, the y-values approach - ∞. As each section nears the asymptote on its right, the y-values approach + ∞.
Notice the behavior of y = cot x. Notice what happens to each section of the graph as it nears its asymptotes. As each section nears the asymptote on its left, the y-values approach + ∞. As each section nears the asymptote on its right, the y-values approach - ∞.
This is the graph for y = tan x. y = - tan x Consider the graph for y = - tan x In this equation a, the numerical coefficient for the tangent, is equal to -1. The fact that a is negative causes the graph to “flip” or reflect about the x-axis.
This is the graph for y = cot x. y = - 2cot x Consider the graph for y = - 2 cot x In this equation a, the numerical coefficient for the cotangent, is equal to -2. The fact that a is negative causes the graph to “flip” or reflect about the x-axis.
y = a tanb (x - c) y = a cotb (x - c) b affects the period of the tangent or cotangent graph. For tangent and cotangent graphs, the period can be determined by Conversely, when you already know the period of a tangent or cotangent graph, b can be determined by
A complete period (including two consecutive vertical asymptotes) has been highlighted on the tangent graph below. For all tangent graphs, the period is equal to the distance between any two consecutive vertical asymptotes. The distance between the asymptotes in this graph is . Therefore, the period of this graph is also .
Use , the period of this tangent graph, to calculate b. We will let a = 1, but a could be any positive value since the graph has not been reflected about the x-axis. An equation for this graph can be written as or .
A complete period (including two consecutive vertical asymptotes) has been highlighted on the cotangent graph below. For all cotangent graphs, the period is equal to the distance between any two consecutive vertical asymptotes. The distance between the asymptotes is . Therefore, the period of this graph is also .
Use , the period of this cotangent graph, to calculate b. We will let a = 1, but a could be any positive value since the graph has not been reflected about the x-axis. An equation for this graph can be written as or .
y = tan x has no phase shift. We designated the y-intercept, located at (0,0), as the key point.
y = cot x has no phase shift. x = 0 We designated the vertical asymptote on the y-axis (at x = 0) as the key asymptote.
If the key point on a tangent graph shifts to the left or to the right, or if the key asymptote on a cotangent graph shifts to the left or to the right, that horizontal shift is called a phase shift.
y = a tan b (x - c) c indicates the phase shift of a tangent graph. For a tangent graph, the x-coordinate of the key point is c. For this graph, c = because the key point shifted spaces to the right. An equation for this graph can be written as .
y = a cot b (x – c) c indicates the phase shift of a cotangent graph. For a cotangent graph, c is the value of x in the key vertical asymptote. For this graph, c = because the key asymptote shifted left to . An equation for this graph can be written as or
Graphs whose equations can be written as a tangent function can also be written as a cotangent function. Given the graph above, it is possible to write an equation for the graph. We will look at how to write both a tangent equation that describes this graph and a cotangent equation that describes the graph. The tangent equation will be written as y = a tan b (x – c). The cotangent equation will be written as y = a cot b (x – c).
For the tangent function, the values for a, b, and cmust be determined. This tangent graph has reflected about the x-axis, so a must be negative. We will use a = -1. The period of the graph is . The key point did not shift, so the phase shift is 0. c = 0
For the cotangent function, the values for a, b, and cmust be determined. This cotangent graph has not reflected about the x-axis, so a must be positive. We will use a = 1. The period of the graph is . The key asymptote has shifted spaces to the right , so the phase shift is . Therefore, .
It is important to be able to draw a tangent graph when you are given the corresponding equation. Consider the equation Begin by looking at a, b, and c.
The negative sign here means that the tangent graph reflects or “flips” about the x-axis. The graph will look like this.
b = 3 Use bto calculate the period. Remember that the period is the distance between vertical asymptotes.
This phase shift means the key point has shifted spaces to the right. It’s x-coordinate is . Also, notice that the key point is an x-intercept.
Since the key point, an x-intercept, is exactly halfway between two vertical asymptotes, the distance from this x-intercept to the vertical asymptote on either side is equal to half of the period. The period is ; half of the period is . Therefore, the distance between the x-intercept and the asymptotes on either side is .
We can use half of the period to figure out the labels for vertical asymptotes and x-intercepts on the graph. Since we already determined that there is an x-intercept at , we can add half of the period to find the vertical asymptote to the right of this x-intercept. Vertical asymptote x-intercept Half of the period
Continue to add or subtract half of the period, , to determine the labels for additional x-intercepts and vertical asymptotes. x-intercept Vertical asymptote Half of the period
It is important to be able to draw a cotangent graph when you are given the corresponding equation. Consider the equation Begin by looking at a, b, and c.
The positive sign here means that the cotangent graph does not reflect or “flip” about the x-axis. The graph will look like this.
b = 4 Use bto calculate the period. Remember that the period is the distance between vertical asymptotes.
This phase shift means the key asymptote has shifted spaces to the left. The equation for this key asymptote is .
The distance from an asymptote to the x-intercepts on either side of it is equal to half of the period. The period is ; half of the period is . Therefore, the distance between asymptotes and their adjacent x-intercepts is . This information can be used to label asymptotes and x-intercepts.
Sometimes a tangent or cotangent graph may be shifted up or down. This is called a vertical shift. The equation for a tangent graph with a vertical shift can be written as y = a tan b (x - c) +d. The equation for a cotangent graph with a vertical shift can be written as y = a cot b (x - c) +d. In both of these equations, d represents the vertical shift.
A good strategy for graphing a tangent or cotangent function that has a vertical shift: • Graph the function without the vertical shift • Shift the graph up or down d units. • Consider the graph for . • The equation is in the form where“d” equals • 3, so the vertical shift is 3. The graph of was drawn in the previous example.
To draw , begin with the graph for . Draw a new horizontal axis at y = 3. Then shift the graph up 3 units. 3 The graph now represents .