Download
1 / 38
380 likes | 488 Views
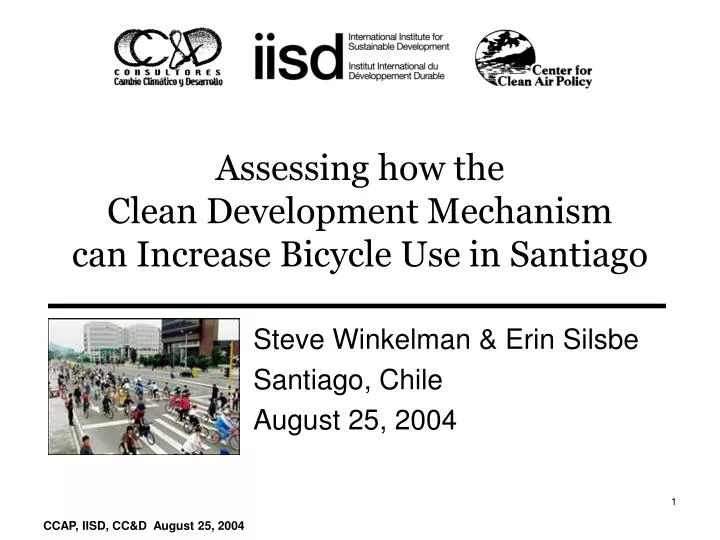
Assessing how the Clean Development Mechanism can Increase Bicycle Use in Santiago. Steve Winkelman & Erin Silsbe Santiago, Chile August 25, 2004. Overview. Introduction and context Bicycles and the CDM Methodological Issues Sample Calculations Initial Conclusions Respondents.

E N D
Assessing how the Clean Development Mechanism can Increase Bicycle Use in Santiago Steve Winkelman & Erin Silsbe Santiago, Chile August 25, 2004 CCAP, IISD, CC&D August 25, 2004
Overview • Introduction and context • Bicycles and the CDM • Methodological Issues • Sample Calculations • Initial Conclusions • Respondents CCAP, IISD, CC&D August 25, 2004
Bicycle Use Offers ManySocietal Benefits • Improved air quality • Lower energy use and GHG emissions • Reduction of traffic congestion • Promotion of healthier lifestyles • Traffic safety • Social equity, poverty reduction CCAP, IISD, CC&D August 25, 2004
Cycling + Walking = Lower Emissions Non-Motorized Mode Share and Annual per Capita Energy Use Source: IPCC, 1995, Pucher et. al CCAP, IISD, CC&D August 25, 2004
Context: Santiago Mode Split Note: 2001 O-D data adjusted for comparison with 1991 CCAP, IISD, CC&D August 25, 2004
Santiago: Mode Share by Distance Fuente: LABTUS para IISD, 2004 Short trips are disproportionately polluting…these are the trips that are most suitable for non-motorized transport (NMT) CCAP, IISD, CC&D August 25, 2004
Potential Bicycle Projects & Policies • Bicycle projects could include • bike lanes • segregated bikeways • parking facilities • promotional activities • incentives • bicycle signage • traffic signal improvements • Comprehensive package • The measures above plus extensive connectivity in the bicycle network CCAP, IISD, CC&D August 25, 2004
International Comparison CCAP, IISD, CC&D August 25, 2004
Bicycle Potential in Santiago Ortúzar et al. (1999): • Bicycle use in Santiago could theoretically increase to 5.8% of all trips with implementation of a major network of bikeways (3.2 km of bikeway per km2) …If even a small percentage of trips were diverted from the private car, the reduction of fossil fuel consumption, greenhouse gases and air pollution could be significant CCAP, IISD, CC&D August 25, 2004
Our Project: Bikes and the CDM Purpose • Assess how the CDM can be used to help increase bicycle use to reduce motor vehicle emissions in Santiago Approach • Address methodological issues • Consider two different scales • An individual bikeway project • A Comprehensive “Santiago-wide” policy CCAP, IISD, CC&D August 25, 2004
Methodological Issues • Forecasting Bicycle Use • How many additional bike trips of what length are expected from the project? • Baseline • How would travel have occurred in the absence of the proposed project activity (car, bus, etc.)? • Must take into account existing projects, policies (e.g., Alameda, GEF bikeways) • Monitoring • Determine number and length of new trips • Avoided emissions • Difference between actual emissions and those that would have occurred had new trips followed the baseline mode split CCAP, IISD, CC&D August 25, 2004
Forecasting Bicycle Demand (1) Rough Estimates • Typical: either no forecasting, or simplistic assumptions • Comparison studies (before-and-after, similar conditions) • Aggregate behavior (e.g., regression on population characteristics) • Rules of thumb, multipliers, adjustment factors (e.g., CARB) Measures of Potential Demand • “Revealed” preference surveys (e.g., from traffic counts) • “Stated” preference surveys (attitudinal or hypothetical) Note: This section based in large part upon the U.S. Federal Highway Administration (FHWA) NMT Guidebook CCAP, IISD, CC&D August 25, 2004
Forecasting Bicycle Demand (2) Discrete Choice Models (e.g., logit model) • Widely used to predict mode choice • Based on “stated” or “revealed” preferences • May require extensive survey data and technical expertise • Very useful for isolating effects of specific factors Regional Travel Models • Most models ignore pedestrians & bicycles • Traditional modeling techniques ineffective for bicycles (Katz) • Rough adjustments are typical (e.g., pedestrian environment factors) • Requires significant data and technical expertise • Can be powerful tool but significant research needs remain CCAP, IISD, CC&D August 25, 2004
Forecasting Bicycle Demand (3) Ortuzar, Iacobelli and Valeze (1999): “Estimating Demand for a Cycle-way Network” • Household survey (stratified sample) • Stated preference mode choice survey • Logit model on willingness to cycle • Generated trip matrices to plug into the regional travel model, ESTRAUS • Assumed a bikeway network of 3.2 km per km2 • Calculated that bicycle use in Santiago could increase from 1.6% to 5.8% of total trips CCAP, IISD, CC&D August 25, 2004
Baseline Data Needs Ideal data • Projected mode split for short trips along the affected corridor or in that specific neighborhood? Acceptable data • Current mode split for all short trips in the region Minimum Necessary data • Current mode split for all trips for the region CCAP, IISD, CC&D August 25, 2004
Available Baseline Data in Santiago Ideal? • ESTRAUS forecast for short trips Acceptable? • 2001 O-D data on mode split for short trips • Simplistic forecast based on extrapolation of trends (e.g. 1991-2001) Minimum Necessary? • 2001 O-D data on mode split for all trips CCAP, IISD, CC&D August 25, 2004
Dynamic Baseline • Use actual (not projected) mode split data • For all short trips or • For short trips in places with similar land use characteristics and demographics • Account for factors that influence bicycle use • Motor vehicle characteristics • Car ownership • traffic in surrounding area • Demographics • Population • Age distribution (e.g., number of students) • Economic variables • Fuel prices • Gross National Product • Other projects and policies • Attractive in theory, but complicated in practice? CCAP, IISD, CC&D August 25, 2004
Key Baseline Challenge • Can the baseline be defined sufficiently well that bike count data can be used to assess the travel and emissions impact? • Is it necessary to determine who are new riders? • Would surveys asking cyclists what travel mode they would have used without the project increase certainty? CCAP, IISD, CC&D August 25, 2004
Additionality • Bicycle projects seen as additional because: • No regulation requires development of bikeways • There is limited investment in bikeways in Santiago (e.g., need GEF investment) • Cultural and image (pscyhological?) barriers appear to prevent greater bicycle use CCAP, IISD, CC&D August 25, 2004
Forecasting Travel Impacts • Shorter term, many bikeway users may be lower income and shifting from bus • Longer term, with comprehensive network more people might shift from cars to bike • This longer term effect is inherently reflected in the 2015 mode split forecast assumptions CCAP, IISD, CC&D August 25, 2004
Monitoring (1) Bicycle Counts • Survey points: Natural barriers or define “screen” lines • Frequency and Duration: short counts more useful than infrequent all-day counts to reflect change over time • Periods: Peak, off-peak, lunchtime • May differ from motorized modes • Note weather conditions, singular events • Use of automated counters is worth exploring • Tampering concerns? Based upon Hudson, Bicycle Planning: Policy and Practice (1982). CCAP, IISD, CC&D August 25, 2004
Monitoring (2) Surveys • Roadside, destination-based, home-based • Establish: trip length, purpose, route, alternative mode or route choice (without project) Balancing Robustness with Practicality • What frequency and scope are sufficient? • Statistically significant? • Comprehensive policies can be tracked with regional vehicle-km traveled and mode split data • Isolating the impacts of specific small-scale projects may be overly resource intensive (GEF $30,000 for basic survey work) • Update dynamic baseline with demographic & traffic data CCAP, IISD, CC&D August 25, 2004
Assumptions for Sample Calculations: Emission Factors Car:141 g CO2 per passenger-km • Assume loading of 2 people per car • Reflects that reduction of car passengers does not necessarily imply a reduction in number of car trips Bus:40 g CO2 per passenger-km • Assume loading of 40 people per bus • While high for a daily average, this is intended as a conservative assumption. One could also argue that no emissions are displaced with a bus-to-bike shift. Other:(walk, bike, metro, taxi) Assume no displaced emissions (conservative) CCAP, IISD, CC&D August 25, 2004
Short-Trip Mode Split Assumptions for Sample Calculations Short-trip mode split data from DICTUC Note: 2015 based on extrapolation of 1991 -2001 growth trends (for all trips) CCAP, IISD, CC&D August 25, 2004
Cost Assumptions Infrastructure Costs • Range: $70 - $100K+ per km of bikeway (GEF, SECTRA) • Other determining factors • lighting, maintenance, signs, intersection modifications, traffic signaling, enforcement, cost sharing arrangements, etc. • Bike Lanes cost only 5% of segregated bikeways (SECTRA) CDM-Related Costs and Benefits • Emission credit value: We assume $5/tonne for calculations • Monitoring costs? • CDM project cycle costs? • Cheaper if small scale projects are bundled? • Co-benefits not included CCAP, IISD, CC&D August 25, 2004
Project Example: New Bikeway Assumptions • 4.5 km bikeway • Baseline: Estimated 2015 future mode split (above) • Average round-trip length: 6 km Emissions Savings • With 1,000 users/day, 260 days/year: 63 tonnes CO2 per year Costs • $80,000 per km • Over 10 years: $533/tonne CO2 • At $5/tonne CERs only contribute 1% of total costs • Enough to help with maintenance costs? CCAP, IISD, CC&D August 25, 2004
Policy Example: Comprehensive Bicycle Network Assumptions • Assume total trips double from 2001 – 2015 • based on 1991 -2001 growth rate • Use estimated future mode split for short trips: • Average round trip length: 6 km • 260 weekdays per year • 1,200 km bicycle network • 600 km bikeway • 600 km bike lanes • $58,000 per km (average from CONASET) CCAP, IISD, CC&D August 25, 2004
Policy Scenarios: Annual Savings and Costs in 2015 • Increase bike mode share from 1.9% to:3% (conservative), 6% (Ortúzar), 23% (Amsterdam), or 65%(break-even at $5/t) New Bicycle Tonnes Cost Per CDM Value Mode Share CO2 tonne CO2($5/tonne CO2) 3% 23,500 $279 $ 117,300 6% 85,600 $76 $ 427,800 23% 476,100 $14 $2,380,300 65% 1,308,800 $ 5 $6,544,200 CCAP, IISD, CC&D August 25, 2004
Policy Example: Costs • CDM could offset 2% to 6% of project costs in the more realistic scenarios (3%, 6% mode share) • Higher if CER value > $5/tonne • Higher if consider longer project lifetime (14, 21 yrs) • Costs could be lower if same bike use could be achieved with fewer km of bikeway • E.g., less expensive bike lanes • Promotional campaigns • Including co-benefits makes bike projects more attractive from a societal perspective CCAP, IISD, CC&D August 25, 2004
Initial Conclusions • Individual bikeways not viable as a CDM project given current rules and expected credit values • Bundling of multiple projects may help • A comprehensive network of segregated bikeways plus (cheaper) bike lanes could potentially work • Cost-sharing that reflects co-benefits could help make the CDM more viable • e.g., with air quality improvement programs, or other transportation infrastructure projects • A revolving loan approach could be used to recycle funds back into projects when CDM credits are sold CCAP, IISD, CC&D August 25, 2004
Addressing Uncertainty • Quantifying emissions impacts of bicycle projects and policies is difficult • Can conservative assumptions minimize uncertainty enough to attract investors and to gain approval of the EB/Meth panel? • Discounting of emissions benefits may be appropriate • Small-scale project methodologies allow for streamlining • simplified baseline and monitoring requirements • lower transaction costs CCAP, IISD, CC&D August 25, 2004
Innovative Ideas (heretical?) • Official Development Assistance (ODA) cannot be used for CDM projects • Perhaps demand side projects require special treatment • ODA could make sense to support basic data collection and monitoring as part of a broader sustainability strategy • It has been observed that provision of infrastructure does not guarantee use • Promotional campaigns may be key to increasing bike use (Ortuzar, GEF) • Land use policies can enable shorter trips suitable for bikes (Ortuzar) (Land use will be discussed in the next session) • Could ODA fund bike infrastructure and sell CERs to fund promotional strategy or maintenance?? • Can full project impacts be counted if CERs only fund a small portion? CCAP, IISD, CC&D August 25, 2004
High Opportunity Costs • Rapid growth in car ownership and use appears inevitable • Availability of efficient options such as bicycle infrastructure will require deliberate planning and investment • Current infrastructure and investment and development decisions have a major impact on future emissions • Developing bicycle networks now can advance multiple sustainability goals • Consider building bike lanes into road maintenance and construction • There are high opportunity costs for not investing in efficient modes bicycle, pedestrian, transit and sustainable land use Puts the world on high-GHG pathway! CCAP, IISD, CC&D August 25, 2004
Closing Challenge • Rapid growth in driving continues to outpace vehicle efficiency improvements • If the CDM cannot significantly advance non-motorized modes then other policy mechanisms will be necessary (US data) CCAP, IISD, CC&D August 25, 2004
Respondents • Cesar Garrido, CONASET • Dr. Juan de Dios Ortúzar, Universidad Catolica de Chile • Ricardo Montezuma, Fundación Ciudad Humana CCAP, IISD, CC&D August 25, 2004
Cesar GarridoCONASET Implementation of CDM Bike Projects in Santiago • Policy context: brief overview of bike policies in Santiago • How can CDM consideration be incorporated into the next bike project or policy? • Can you foresee the CDM helping to overcome some of barriers to bike lane development in Santiago? What do you see as the biggest hurdles? • Can monitoring be built into any existing initiatives? • What will it take to achieve significant bicycle use in Santiago? CCAP, IISD, CC&D August 25, 2004
Prof. Juan de Dios OrtúzarUniversidad Catolica de Chile Methodological Issues • Accuracy of O-D bicycle data? • Reliability of bicycle demand forecasting approaches? • Practicality of dynamic baselines? • Improvements on avoided emissions calculation? • What level of monitoring is credible? Reasonable? CCAP, IISD, CC&D August 25, 2004
Ricardo Montezuma Fundación Ciudad Humana Replicability of Case Study to Bogotá, Columbia • Bogotá experience, plans and needs for- monitoring bicycle use- promoting bicycle use • Thoughts on sufficiency of modeling capability, monitoring resources and data quality for assessing bicycle project impacts CCAP, IISD, CC&D August 25, 2004