Human Population Review
480 likes | 497 Views
This chapter discusses how to determine population growth rate, the factors influencing growth rates in developing and developed countries, the theory of demographic transition, and the impact of urban areas on resource consumption.

Human Population Review
E N D
Presentation Transcript
Human Population Review Chapter 7 2015
Chapter 7 test P 199-200 1 B 2 E 3 A 4 E 5 C 6 E 7 C 8 C 9 D 10 D
How do you determine a populations growth rate? Count the number of people that were born, died, emigrated and immigrated and compare that to the number of people which existed the previous year.
Determine the population growth rate if there were 20,000 people living on Catalina in 2012 and in 2013 100 babies were born, 50 people died, 5 people immigrated to the island and 3 people emigrated from the island.
Determine the population growth rate if there were 20,000 people living on Catalina in 2012 and in 2013 100 babies were born, 50 people died, 5 people immigrated to the island and 3 people emigrated from the island. • 100 births+ 5immigrants – 50deaths -3emigres = an increase of 52 people • 52 people/20,000 people = 0.25% growth rate 20,052 – 20,000 x 100 = 0.25% 20,000
If Catalina has a 0.25% growth rate, how many years will it take the population to double?
If Catalina has a 0.25% growth rate, how many years will it take the population to double? Use the rule of 70: 70/0.25 = 280 YEARS
Define the following: Crude Birth Rate, Crude Death Rate, the Total Fertility Rate and Replacement Level Fertility CBR = CDR = TFR = RLF =
Define the following: Crude Birth Rate, Crude Death Rate, the Total Fertility Rate and Replacement Level Fertility CBR = Number of births per 1000 people CDR = Number of deaths per 1000 people TFR = Average number of children each woman will have RLF = Number of children each couple must have to prevent the population from declining. (2.1 in U.S.)
Calculate the population growth rate of the world if the CDR is 8 and the CBR is 20.
Calculate the population growth rate of the world if the CDR is 8 and the CBR is 20. World population growth rate = (CBR-CDR) divided by 10 Divide by 10 because CBR and CDR are per 1000 people. (20-8) divided by 10 = 1.2 percent.
If the world’s human population is growing at a 1.2% rate, how long will it take for the world’s population to double?
If the world’s human population is growing at a 1.2% rate, how long will it take for the world’s population to double? Use the Rule of 70 to calculate doubling time. 70/1.2 = 58 years
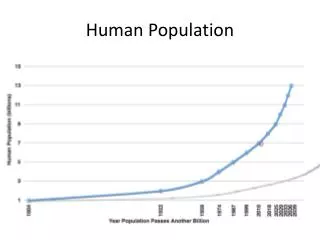
What type of growth is illustrated by the graph of human population below? Human population in billions Year
What type of growth is illustrated by the graph of human population below? Exponential Growth Human population in billions Year
Look at the age structures below and determine which population is growing the fastest and which is declining the fastest.
Look at the age structures below and determine which population is growing the fastest and which is declining the fastest. Nigeria is growing the fastest and Bulgaria is declining the fastest.
Know the factors that influence growth rates of developing and developed countries.
Know the factors that influence growth rates of developing and developed countries. Developed Countries Good nutrition/potable water Good health care High GDP per capita High Literacy Rates High value placed on women Education is important Having many children to work the land or take care of elders is not considered important. Developing Countries Poor nutrition/non potable water Poor health care Low GDP per capita Low Literacy Rates Low value placed on women Low value placed on education Children are important sources of income and take care of elders.
Urban Areas = _____% of the worlds population. Urban Areas consume _______% of the world’s resources.
Urban Areas = __50___% of the worlds population. Urban Areas consume __75_____% of the world’s resources.
List the factors that make some countries have a high infant mortality rate
List the factors that make some countries have a high infant mortality rate limited access to health care, poor nutrition, non potable water, low GDP per capita, proximity of pollutants
Know the Theory of Demographic Transition – Which two stages have birth rates and death rates that are closest together?
Know the Theory of Demographic Transition – Which two stages have birth rates and death rates that are closest together? 1 & 4
Know the Theory of Demographic Transition – Which stage has the highest birth rates and death rates?
Know the Theory of Demographic Transition – Which stage has the highest birth rates and death rates? 1
Know the Theory of Demographic Transition – Which stage includes most developed countries?
Know the Theory of Demographic Transition – Which stage includes most developed countries? 4
Know the Theory of Demographic Transition – Which stage has the highest population growth rate?
Know the Theory of Demographic Transition – Which stage has the highest population growth rate? 2
Know the Theory of Demographic Transition – Which age structure diagram would depict population growth in Stage 1?
Know the Theory of Demographic Transition – Which age structure diagram would depict population growth in Stage 1? rectangle
Which of the age structures below indicate a declining population? two three one
Which of the age structures below indicate a declining population? Three two three one
When women delay childbearing, the average fertility rate ___________.
When women delay childbearing, the average fertility rate __decreases__.
The US population is approximately 320 million people. The world population is approximately 7 billion people. The US population represents what percent of the world population?
The US population is approximately 320 million people. The world population is approximately 7 billion people. The US population represents what percent of the world population? 320,000,000/7000000000 x 100 = 4.6%
What factors influence a country’s impact on the environment?
What factors influence a country’s impact on the environment? I=PATPopulation, Affluence & Technology
As a country’s GDP increases: Access to health care _______________. Infant mortality ________________________. Longevity ____________________________. Birth rate ____________________________.
As a country’s GDP increases: Access to health care increases. Infant mortality decreases. Longevity increases. Birth rate decreases.
The correlation between the percentage of literate women in a country and that country’s fertility rate is
The correlation between the percentage of literate women in a country and that country’s fertility rate is As the literacy rate increases, the fertility rate decreases.
Has the carrying capacity of the human population been exceeded?
Has the carrying capacity of the human population been exceeded? NO