Download
1 / 1
10 likes | 98 Views
Study on wind-driven transport variability in Florida Big Bend region, focusing on gag grouper larvae migration from outer shelf to coastal sea grass beds for spawning. Ocean and atmosphere modeling system developed using ROMS to understand larval transport mechanisms.

E N D
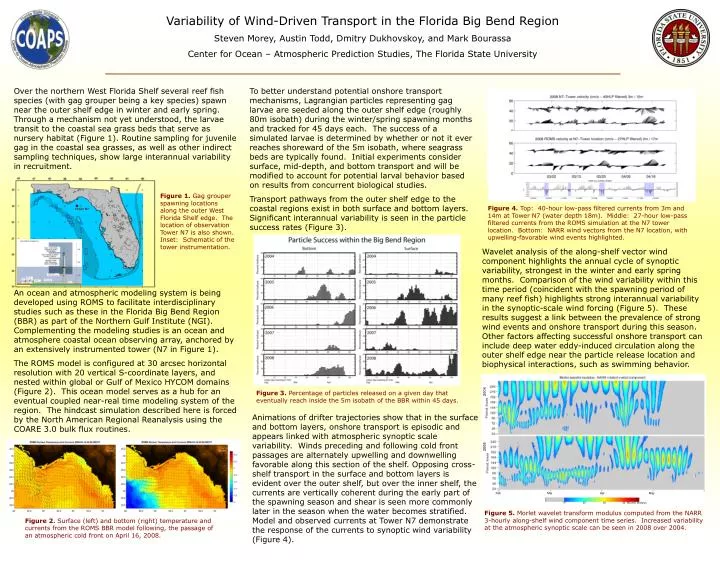
Tower N7 2004 2008 Feb Mar Apr May 10 20 30 40 Wavelet Modulus Variability of Wind-Driven Transport in the Florida Big Bend Region Steven Morey, Austin Todd, Dmitry Dukhovskoy, and Mark Bourassa Center for Ocean – Atmospheric Prediction Studies, The Florida State University Over the northern West Florida Shelf several reef fish species (with gag grouper being a key species) spawn near the outer shelf edge in winter and early spring. Through a mechanism not yet understood, the larvae transit to the coastal sea grass beds that serve as nursery habitat (Figure 1). Routine sampling for juvenile gag in the coastal sea grasses, as well as other indirect sampling techniques, show large interannual variability in recruitment. An ocean and atmospheric modeling system is being developed using ROMS to facilitate interdisciplinary studies such as these in the Florida Big Bend Region (BBR) as part of the Northern Gulf Institute (NGI). Complementing the modeling studies is an ocean and atmosphere coastal ocean observing array, anchored by an extensively instrumented tower (N7 in Figure 1). The ROMS model is configured at 30 arcsec horizontal resolution with 20 vertical S-coordinate layers, and nested within global or Gulf of Mexico HYCOM domains (Figure 2). This ocean model serves as a hub for an eventual coupled near-real time modeling system of the region. The hindcast simulation described here is forced by the North American Regional Reanalysis using the COARE 3.0 bulk flux routines. To better understand potential onshore transport mechanisms, Lagrangian particles representing gag larvae are seeded along the outer shelf edge (roughly 80m isobath) during the winter/spring spawning months and tracked for 45 days each. The success of a simulated larvae is determined by whether or not it ever reaches shoreward of the 5m isobath, where seagrass beds are typically found. Initial experiments consider surface, mid-depth, and bottom transport and will be modified to account for potential larval behavior based on results from concurrent biological studies. Transport pathways from the outer shelf edge to the coastal regions exist in both surface and bottom layers. Significant interannual variability is seen in the particle success rates (Figure 3). Figure 1. Gag grouper spawning locations along the outer West Florida Shelf edge. The location of observation Tower N7 is also shown. Inset: Schematic of the tower instrumentation. Figure 4. Top: 40-hour low-pass filtered currents from 3m and 14m at Tower N7 (water depth 18m). Middle: 27-hour low-pass filtered currents from the ROMS simulation at the N7 tower location. Bottom: NARR wind vectors from the N7 location, with upwelling-favorable wind events highlighted. Wavelet analysis of the along-shelf vector wind component highlights the annual cycle of synoptic variability, strongest in the winter and early spring months. Comparison of the wind variability within this time period (coincident with the spawning period of many reef fish) highlights strong interannual variability in the synoptic-scale wind forcing (Figure 5). These results suggest a link between the prevalence of strong wind events and onshore transport during this season. Other factors affecting successful onshore transport can include deep water eddy-induced circulation along the outer shelf edge near the particle release location and biophysical interactions, such as swimming behavior. Figure 3. Percentage of particles released on a given day that eventually reach inside the 5m isobath of the BBR within 45 days. Animations of drifter trajectories show that in the surface and bottom layers, onshore transport is episodic and appears linked with atmospheric synoptic scale variability. Winds preceding and following cold front passages are alternately upwelling and downwelling favorable along this section of the shelf. Opposing cross-shelf transport in the surface and bottom layers is evident over the outer shelf, but over the inner shelf, the currents are vertically coherent during the early part of the spawning season and shear is seen more commonly later in the season when the water becomes stratified. Model and observed currents at Tower N7 demonstrate the response of the currents to synoptic wind variability (Figure 4). Figure 5. Morlet wavelet transform modulus computed from the NARR 3-hourly along-shelf wind component time series. Increased variability at the atmospheric synoptic scale can be seen in 2008 over 2004. Figure 2. Surface (left) and bottom (right) temperature and currents from the ROMS BBR model following, the passage of an atmospheric cold front on April 16, 2008.