Download
1 / 1
10 likes | 153 Views
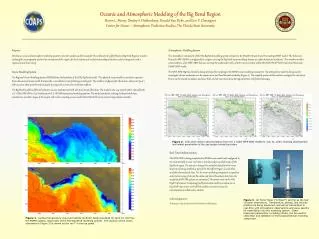
S -1. °C. PSU. Oceanic and Atmospheric Modeling of the Big Bend Region Steven L. Morey, Dmitry S. Dukhovksoy, Donald Van Dyke, and Eric P. Chassignet Center for Ocean – Atmospheric Prediction Studies, The Florida State University. Purpose

E N D
S-1 °C PSU Oceanic and Atmospheric Modeling of the Big Bend Region Steven L. Morey, Dmitry S. Dukhovksoy, Donald Van Dyke, and Eric P. Chassignet Center for Ocean – Atmospheric Prediction Studies, The Florida State University Purpose Develop an ocean and atmospheric modeling system to provide analyses and forecasts for the northeastern Gulf of Mexico (Big Bend Region), to aid in studying the oceanography and marine ecosystems of the region, for local marine and coastal meteorological studies, and for integration with a regional ocean observatory. Ocean Modeling System The Regional Ocean Modeling System (ROMS) forms the backbone of the FSU Big Bend model. This physical ocean model is a primitive equation three-dimensional ocean model that uses the s-coordinate terrain-following vertical grid. The model is configured for the domain shown in Figure 1 with 30 arcsec (800-900m) horizontal grid spacing and 25 vertical s-coordinate surfaces. The Big Bend model has fifteen freshwater sources implemented with real-time stream flow data. The model is one-way nested within optionally the 1/12° Global HYCOM or 1/25° Southeastern U.S. HYCOM operational modeling systems. The model simulation is being developed with data assimilation, and later stages of the project will involve coupling a wave model (WaveWatch III) and a marine biogeochemical model. Atmospheric Modeling System The atmospheric component of the FSU Big Bend modeling system is based on the Weather Research and Forecasting (WRF) model. The Advanced Research WRF (ARW) is configured for a region covering the Big Bend ocean modeling domain at 1.33km horizontal resolution. This weather model is nested within a 4 km WRF-ARW domain covering the southeastern U.S., which in turn is nested within the NOAA NCEP North American Mesoscale (NAM) WRF model. The WRF-ARW Big Bend model is being developed for coupling to the ROMS ocean modeling component. The atmospheric model is being used to investigate cold air outbreaks over the marine area, and local diurnal variability (Figure 2). The coupled system will be used to investigate the role of sea breeze on the coastal circulation and wave field, and air-sea interactions during wintertime cold frontal passages. * Figure 2. 10m wind vectors and divergence from the 1.33km WRF-ARW model for July 31, 2007, showing development and inland penetration of the sea breeze frontal boundary. Real-Time Implementation The WRF-ARW is being coupled to the ROMS ocean model and configured to run operationally in near real-time to provide analyses and forecasts of the Big Bend region. The system is designed to assimilate data from the ocean observatory being installed as part of the NGI effort (Figure 3), and other available observational data. For the ocean modeling component, acquisition and preprocessing of stream flow data and lateral boundary data from the operational HYCOM system are automated. The system runs on the FSU High Performance Computing facility and output will be provided on an OpenDAP data server at COAPS for public use and to be used in interdisciplinary collaborative studies. Acknowledgements This project is funded by the NOAA Northern Gulf Institute. Figure 3. Air Force Tower (“K-Tower”) serving as the hub of ocean observatory. Temperature, salinity, and velocity profiles are being measured, and will be transmitted in real-time with atmospheric observations and wave spectra for assimilation into the modeling system. Other measured parameters, including nitrate, can be used for calibration and validation of the biogeochemical modeling component. Figure 1. Surface temperature (top) and salinity (bottom) fields simulated for April 10, 2007 by the ROMS oceanic component of the FSU Big Bend modeling system. The location of the ocean observatory (Figure 3) is shown by the red * in the top panel.