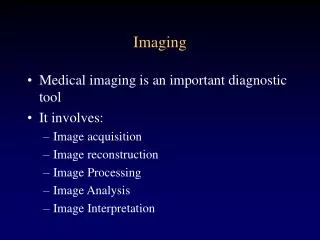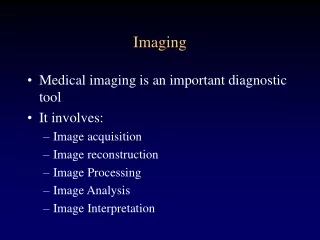
Imaging
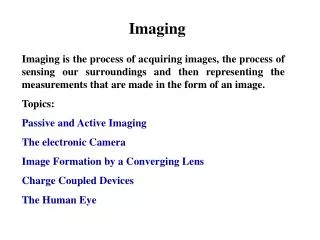
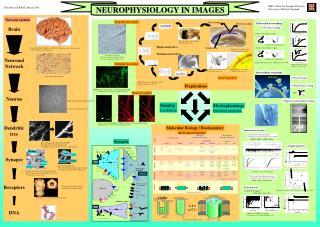
NEUROPHYSIOLOGY IN IMAGES. NEUROPHYSIOLOGY IN IMAGES. CA1. CA1. CA2. CA2. 4. Brain. Extracellular recording. EPSP slope (mV/ms). 2. Field recording. 100. 200. Stimulus duration ( m s). Somatic extracellular recording. CA3. CA3. 2. DG. DG. 1. Fiber volley (mV). fEPSP.

Imaging
E N D
Presentation Transcript
NEUROPHYSIOLOGY IN IMAGES NEUROPHYSIOLOGY IN IMAGES CA1 CA1 CA2 CA2 4 Brain Extracellular recording EPSP slope (mV/ms) 2 Field recording 100 200 Stimulus duration (ms) Somatic extracellular recording CA3 CA3 2 DG DG 1 Fiber volley (mV) fEPSP p.s. 100 200 Stimulus duration (ms) 4 mV Subthreshold Suprathreshold Dendritic extracellular recording 10 ms 12 8 mV mV Neuronal Network Population spike (mV) fEPSP ms ms 4 f.v. 2 mV 100 200 10 ms Stimulus duration (ms) Subthreshold Suprathreshold Adapted from C.H. Davies, PhD thesis 1991, UOB Adapted from E.J. Coan, PhD thesis 1988, UOB EPSC 50 pA 50 ms Neuron Dendritic tree Ionotropic Glutamate Receptors Metabotropic Glutamate Receptors GABA Receptors Names Non NMDA Types: GABAA GABAB NMDA AMPA Kainate I II III Ca2+ permeable Low affinity, Ca2+ permeable Sites GluR1,2,3,4 GluR5,6,7 GABA BZ a: 6 s/u, b: 4 s/u g 1,2,3 d 1 r 1,2,3 e 1 GABAB R1a,b,c,d R2 NR1 a,b,c,d,e, NR2 A,B,C,D mGlu1,5 mGlu2,3 mGlu4,6,7,8 Subunits Ca2+ impermeable Low affinity, Ca2+ impermeable Edited GluR2 Edited GluR5,6 Dendrite Spine High affinity Axon KA1,2 Presynaptic bouton Cl- Gi/o AC Ca2+ K+, Na+ Na+, K+ (Ca2+, Mg2+) Na+, K+ (Ca2+) Gq/11 PLC Gi/o AC Gi/o AC Cumulative probability Synapse Signals PSD Postsynaptic spine Dendrite GABA, Isoguvacine, Muscimol Flunitrazepam, Zolpidem, Abecarnil L-Baclofen, GABA Competitive Modulatory Quisqualate, AMPA, Domoate, Glutamate, Kainate Kainate, Glutamate, Domoate, AMPA, ATPA Quisqualate, (S)-DHPG, Glutamate, ACPD, Ibotenate, CHPG5 LY379268, L-CCG-1, DCG-IV, (2R,4R)-APDC, LY354740 , Glutamate, (1S,3S)-ACPD L-AP4 , L-SOP, Glutamate, L-CCG-1 Glial cell Vesicles NMDA, L-Glutamate, L-Aspartate, Ibotenate Glycine, Serine Inter-mEPSC Interval (s) mEPSC Amplitude (pA) Mitochondria Varicosity Agonists From Noel et al. Neuron 23, p. 2 Axon Bicuculline, SR95531 Benzodiazepines, Flumazenil, ZK93426 Phaclofen CGP35348, 2-OH saclofen, CGP55845 D-aAA D-AP5, CGS19755, CGP37849, CGP39551, AP7, CPP 7-chloro kynurenate, CNQX, NO, H+, Mg2+ GYKI53655*, GYKI52466*, NBQX, CNQX LY382884, LY294486, NS102, NBQX, CNQX AIDA, LY3673851, MPEP5*, CPCCOEt1* MCPG MCCG, LY341495, PCCG-IV MCPG LY341495, MAP4, CPPG Antagonists (* non competitive, 1,5 mGlu1 or 5 only) 25 Receptors -20 5 pA Structures 15 20 ms Normalised frequency EPSC amplitude (pA) 5 -80 10 20 -80 -40 0 Time (min) EPSC amplitude (pA) Depression of EPSCs by pep2m From Lüthi et al.1999 Neuron 24, p. 392 DNA MRC Centre for Synaptic Plasticity, University of Bristol, England Dr Fabrice DUPRAT, March 2000 Nervous system Long term slice culture Patch clamp Field recording From G. Paxinos & C. Watson, The Rat Brain, 1998 Hippocampal slices Stimulation From H. ELLIS, B. LOGAN & A. DIXON “Human cross-sectional anatomy" 1991, Ed. Butterworth Heinemann Cytochrome C oxidase stain of a fixed rat barrel cortex Thalamocortical slices 7 days long term culture. Injection in CA3 pyramidal neurons Courtesy of Akira Terashima, 1999 Overnight slice culture 10° From Agmon & Connors 1991, Neurosci. 41, page 370 From Feldmeyer et al. 1999, J. Physiol. 521, page 171 55° Intracellular recordings Network of cortical neurons Patch Clamp Acute brain slices Adapted from Agmon & Connors 1991, Neurosci. 41, pages 365-379 Preparations Blind Patch Clamp EGFP-Sindbis virus infection, CA1 neuron hippocampus A. Terashima, A. Griffiths & F. Duprat, 2000 Neurons in culture High resolution Patch Clamp Hippocampal neuron in culture (P10-14) Imaging Electrophysiology Courtesy of Lisa Pickard, 1999 Localisation Functional properties 5 mm GluR1-4 GluR2 Surface and total distribution of AMPA receptors in cultured hippocampal Neurones. Noel et al.1999, Neuron 23 p.365-376 Molecular Biology / Biochemistry Spontaneous activities Molecular properties 1) Na+-channel independent: minis = spontaneous neurotransmitter release (TTX) mEPSP, mEPSC, mIPSP, mIPSC Synapses Rat CA1 Pyramidal cell labeled with EGFP Two photon laser scanning microscopy From Maletic-Savatic et al. 1999, Science 283, p.1924 Synaptic plasticity 100 EPSC Amplitude (%) Axon 60 -20 0 20 40 Time (min) Rat CA3 Pyramidal cell 3D reconstruction of multiple spine boutons From Toni et al. 1999, Nature 402, p.423 Long Term Depression: LTD Synaptic bouton in rat CA1 stratum radiatum Electron microscopy. From Shepherd et al.1998, J. Neuroscience 18, p.8302 Dendrite +30 2) Na+-channel dependent:spontaneous = spontaneous action potential (no TTX) 0 Change in EPSPslope (%) sEPSP, sEPSC, sIPSP, sIPSC 3D representation of the torpedo nicotinic acetylcholine receptor -30 Evoked activity Frequency (Hz) From Bear 1996 Proc. Natl. Acad. Sci. USA 93, p.13455 = activity of N synapses F. Duprat, march 2000 Long Term Potentiation: LTP EPSP, EPSC, IPSP, IPSC GluRx From Green et al. 1998, Neuron 20, p.427-444 100 EPSC Amplitude (%) x 4 = (x 5 ?) Axon 60 -20 0 20 40 Time (min) F. Aguila & F. Duprat, 1998