Field Map
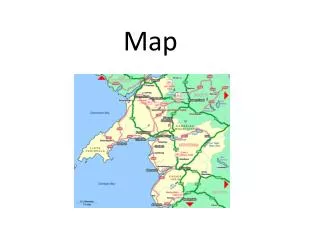
Constructing. A. Field Map. From RegentsEarth.com. This is a FIELD. It is simply an area. It can be as large as the universe. or smaller than the period at the end of this sentence. In this field or any field there are things that can be measured.

Field Map
E N D
Presentation Transcript
Constructing A Field Map From RegentsEarth.com
This is a FIELD. It is simply an area. It can be as large as the universe............. or smaller than the period at the end of this sentence. In this field or any field there are things that can be measured.
We could measure the temperature at different points in the field. Or we could measure the amount of rainfall, or the intensity of sunlight, or the volume of a sound. There is no end to the kinds of things that can be measured as long as there is some way to accurately measure them.
Suppose that we wanted to measure the depth of the snow at various points in the field. What would we have to do? First we would have to send people out into the field to all the different places where we wanted to take measurements. Then we would have to record each measurement and put it on a map of the field. Remember, we are recording the depth of the snow in centimeters.
SNOW DEPTH MAP Each value represents the actual depth of the snow at that location in the real field. 14 35 32 13 15 20 25 26 16 14 23 15 15 18 17 28 The next thing we want to do is to draw lines connecting points of equal value. 20 25 35 40 20 21 24 27 26 “Iso” is a prefix meaning “equal”, so lines that connect points of equal value are called isolines. 25 36 28 32 38 31 37 43 40 35 36 39 44 40 42
Before we start drawing we have to do two things. SNOW DEPTH MAP 14 35 32 13 15 20 25 First, there are a lot of numbers and we may not want to draw lines for all of them. If we did the map might get too crowded with lines. 26 16 14 23 15 15 18 17 28 20 25 35 40 20 21 Suppose we decide to draw the isolines in increments of 5cm. 24 27 26 25 36 28 32 In other words, instead of a line for every value, we only draw lines for 15, 20, 25, 30, 35, and 40cm snow depths. 38 31 37 43 40 35 36 39 This is called the map interval.The interval of this map is 5cm. 44 40 42
SNOW DEPTH MAP The next thing we have to do is plan. 14 35 32 13 15 20 25 26 16 Drawing isolines is a lot like planning a long road trip. 14 23 15 15 18 17 28 You just don’t get into the car and start driving. First you take out a map and plan your route. 20 25 35 40 20 21 24 27 26 25 First, the 15cm line. 36 28 Then the 20cm line. 32 38 31 Then the 25cm line. 37 43 But now we have a problem.............. 40 35 36 39 44 40 42
SNOW DEPTH MAP The interval of the map is 5cm. So the next line we should draw is the 30cm line. 14 35 32 13 15 20 25 26 16 14 23 15 15 But there are no 30’s on the map! How can we draw the line? 18 17 28 20 25 35 40 20 21 This is where planning comes in! 24 27 26 30 is a number between 28 and 31, so put a dot between those two numbers to represent 30. 25 36 28 32 38 31 30 is a number between 27 and 32, so put a dot between those two numbers to represent 30. 37 43 40 35 36 39 44 40 42
SNOW DEPTH MAP You can’t count from 28 to 35 without going through 30 so put a dot between those two numbers. 14 35 32 13 15 20 25 26 16 14 23 15 15 18 But put the dot a little closer to the 28. 17 28 20 25 35 40 20 21 That’s because 30 is closer to 28 than it is to 35. 24 27 26 25 36 And finally 30 must be between 26 and 32 so find those two numbers and put a dot there (a little closer to the 32). 28 32 38 31 37 43 40 35 36 39 44 40 42
SNOW DEPTH MAP OK! Now we’re ready to draw the 30cm isoline! 14 35 32 13 15 20 25 26 16 14 23 15 Now plan the 35cm line. 15 18 17 28 35 is more than 31 but closer to 36 so put a dot where you want your line to go. 20 25 35 40 20 21 24 27 26 And one more dot between 32 and 37. 25 36 28 32 Now you’re ready to draw the 35cm line. 38 31 37 And finally, draw the 40cm isoline. 43 40 35 36 39 44 40 42
SNOW DEPTH MAP Should we draw a 45cm line? 14 35 32 13 15 20 25 26 16 NO! 14 23 15 15 Why? Because there are no points with a value of 45 or greater so you can’t be sure where that line would go. 18 17 28 20 25 35 40 20 21 24 27 26 25 36 If you can’t be sure, don’t draw it! 28 32 Also notice that we have drawn all the lines from one edge of the field to the other. Whenever possible extend isolines to the edges of the map. 38 31 37 43 40 35 36 39 44 40 42
Are there times when the isolines don’t extend to the edges of the field? YES! Look at these values. They represent air pressure measured in units called millibars. 980 980 976 980 The isolines used in air pressure maps are called isobars. 976 972 976 972 When we connect points of equal value the lines form closed paths. 972 976 972 980 976 With practice you will learn to recognize isolines that form closed paths and others that extend to the edges. 976 980 It’s all about............ PRACTICE! 980 980
A couple of regents-style questions: What is the value of point ‘A’? 980 980 ‘A’ is more than 972 but less than 976. It is closer to 976 so point ‘A’ is probably about............. 976 980 976 972 976 972 X 975 972 976 What is the lowest possible value (to the nearest whole number) of point ‘X’? 972 980 976 976 A The map interval is 4. There is no 968 isoline so X must be less than 972 but more than 968. The lowest value for X is.......... 980 969 980 980
What’s wrong with this line? 980 980 It violates an important rule! 976 980 ISOLINES CANNOT CROSS! 976 972 976 Why? Because if they crossed, the points where they intersected would have 2 values at the same time! 972 972 980 976 972 976 These points.......... 976 would have a pressure of 976 and 980 mb at the same instant and that’s 980 IMPOSSIBLE!
One more thing. When drawing isolines try NOT to do this....... 980 980 976 In the real world lines are seldom straight. 980 976 972 So when drawing isolines don’t use a ruler. 976 972 972 Instead use a pencil (so you can erase) and sketch the lines lightly. 976 972 980 976 976 When you’re happy with the lines you’ve drawn, go back and darken them. 980 980 980
REVIEW ISOLINE:A line on a map connecting all points of equal value 980 980 976 980 INTERVAL:The numerical distance between isolines. 976 972 976 What is the interval of this map? 972 972 The interval is 4mb. 976 972 980 Draw smooth, curved lines. 976 Extend the lines to the edges of the map or form closed paths when possible. 976 980 Remember......... Isolines must not cross! 980 BYE! 980