Download
1 / 48
480 likes | 676 Views
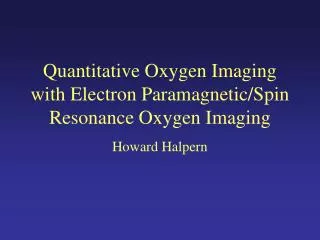
Quantitative Oxygen Imaging with Electron Paramagnetic/Spin Resonance Oxygen Imaging. Howard Halpern. Why EPR?. Bad News: native diffusible unpaired electrons: Rare Good News: rare native electrons mean no background signal

E N D
Quantitative Oxygen Imaging with Electron Paramagnetic/Spin Resonance Oxygen Imaging Howard Halpern
Why EPR? Bad News: native diffusible unpaired electrons: Rare • Good News: rare native electrons mean no background signal • Bad News: Need to infuse subjects with materials with stable unpaired electrons • Good News: Can infuse materials which target pharmacologic compartments
Why EPR? • Spectroscopic Imaging: Specific quantitative sensitivity to Oxygen, Temperature, Viscosity, pH, Thiol Free Radicals can be detected as well • Each property of interest is measured with a specifically designed probe.
Why EPR? • Spectroscopic Imaging: Specific quantitative sensitivity to Oxygen, Temperature, Viscosity, pH, Thiol • No water background for signal imaging (vs MRI)
Why EPR? • Spectroscopic Imaging: Specific quantitative sensitivity to Oxygen, Temperature, Viscosity, pH, Thiol • No water background for signal imaging (vs MRI) • Deep sensitivity at lower frequency (vs optical) • 250 MHz vs 600 THz, 6 orders of magnitude lower • 7 cm skin depth vs < 1 mm • Vs typical EPR (0.009T vs 0.33T electromagnet) • 250 MHz vs 10 GHz, factor of 40 lower • 7 cm skin depth
Why Electron Paramagnetic (Spin) Resonance Imaging? • More sensitive and specific reporter of characteristics of the solvent environment of a paramagnetic reporter • The reporter can be designed to report (mostly) only one characteristic of the environment • E.G.: oxygen concentration, pH, thiol concentrations • We have chosen to image molecular oxygen.
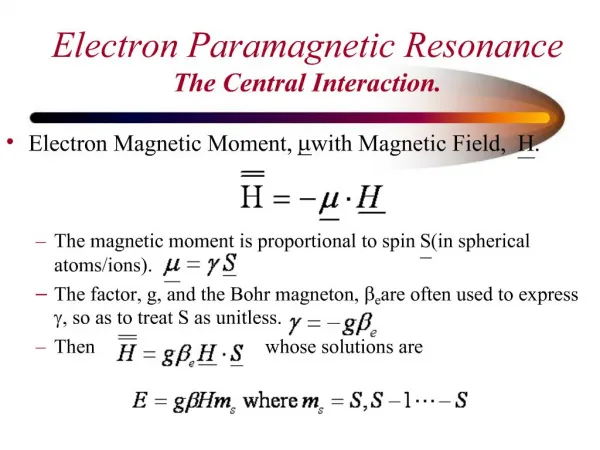
Basic Interaction • Magnetic Moment m (let bold indicate vectors) • Magnetic Field B • Energy of interaction: • E = -µ∙B = -µB cos(θ)
Magnetic Moment • ~ Classical Orbital Dipole • Orbit with diameter r, area a = πr2 • Charge q moves with velocity v; Current is qv/2πr • Moment µ = a∙I = πr2∙qv/2πr = qvr/2 = qmvr/2m • mv×r ~ angular momentum: let mvr “=“ S • β = q/2m; for electron, βe = -e/2me (negative for e) • µB= βeS ; S is in units of ħ • Key 1/m relationship between µ and m • µB (the electron Bohr Magneton) = -9.27 10-24 J/T
Magnitude of the Dipole Moments • Key relationship: |µ| ~ 1/m • Source of principle difference between • EPR experiment • NMR experiment • This is why EPR can be done with cheap electromagnets and magnetic fields ~ 10mT not requiring superconducting magnets
Major consequence on image technique • µelectron=658 µproton (its not quite 1/m); • Proton has anomalous magnetic moment due to “non point like” charge distribution (strong interaction effects) • mproton= 1836 melectron • Anomalous effect multiplies the magnetic moment of the proton by 2.79 so the moment ratio is 658
The Damping Term (Redfield) • ∂ρ*/∂t=1/iћ [H*(t’)1, ρ*(0)]+ 0 (1/iћ)2 ∫dt’[H*1(t),[H*1(t-t’), ρ*(t’)] • Each of the H*1 has a term in it with H= -µ∙Br and µ ~ q/m • ∂ρ*/∂t~ (-) µ2 ρ* This is the damping term: • ρ*~exp(- µ2t with other terms) • Thus, state lifetimes, e.g. T2, are inversely proportional to the square of the coupling constant, µ2 • The state lifetimes, e.g. T2 are proportional to the square of the mass, m2
Consequences of the Damping Term • The coupling of the electron to the magnetic field is 103times larger than that of a water proton so that the states relax 106 times faster • No time for Fourier Imaging techniques • For CW we must use • Fixed stepped gradients • Vary both gradient direction & magnitude (3 angles) 2. Back projection reconstruction in 4-D
Imaging: Basic Strategy Constraint: Electrons relax 106 times faster than water protons Image Acquisition: Projection Reconstruction: Backprojection
Projection Acquisition in EPR • Spectral Spatial Object Support ~
Projection Description • With s(Bsw, Ĝ) defined as the spectrum we get with gradients imposed
More Projection • The integration of fsw is carried out over the hyperplane in 4-space by Defining with The hyperplane becomes with
And a Little More So we can write B = Bsw + c tanα Ĝ∙x
Projection acquisition and image reconstruction Image reconstruction: backprojections in spectral-spatial space Resolution: δx=δB/Gmax THUS THE RESOLUTION OF THE IMAGE PROPORTIONAL TO δB each projection filtered and subsampled; Interpolation of Projections: number of projections x 4 with sinc(?) interpolation, Enabling for fitting Spectral Spatial Object Acquisition: Magnetic field sweep w stepped gradients (G) Projections: Angle a: tan(a)=G*DL/DH
The Ultimate Object: Spectral spatial imaging
Preview: Response of Symmetric Trityl (deuterated) to Oxygen • So measuring the spectrum/spectral width≈relaxation rate measures the oxygen. Imaging the spectrum: Oxygen Image
Why is oxygen important in cancer?
Known Since 1909 but in 1955 Thomlinson and Gray showed necrosis viable tissue
Dramatic differences in survival for patients with cervical cancer treated with radiation depending on mean tumor oxygenation: > or < 10 torr Hockel, et al, Ca Res 56 (1996), p 4509
This was thought to be the source of radiation resistance • Hyperbaric oxygen trials √ (in human trials) • Oxygen mimetic radiosensitizers √ (in • animals only due to toxicity) • Eppendorf electrode measurements (humans)
Intensity Modulated Radiation Therapy • Sculpts radiation dose over distances of 5mm • Able to spare normal tissues But tumor volumes are homogeneous; no accounting for different regions with different sensitivity
Biological imaging to enhance targeting of radiation therapy: oxygen imaging • Intensity modulated radiation therapy allows sophisticated control over spatial distribution of radiation dose
Biological imaging to enhance targeting of radiation therapy: oxygen imaging • Intensity modulated radiation therapy allows sophisticated control over spatial distribution of radiation dose • But: some regions may contain hypoxic cells
0.0076 torr 0.25 torr 1.7 torr Air 0.075 torr Biological imaging to enhance targeting of radiation therapy: oxygen imaging • Hypoxic cells are known to be radioresistant
Biological imaging to enhance targeting of radiation therapy: oxygen imaging • Intensity modulated radiation therapy allows sophisticated control over spatial distribution of radiation dose So... • Areas of hypoxia could be given extra dose if only we could identify them!
Why use radio-frequency for EPR? 250 MHz ~ 6 T MRI S/N ~ w0.8 N~w1.2 IN LOSSY, CONDUCTIVE TISSUE
Aim: Image crucial physiologic information:oxygen Information: Communicated by reporter molecules which are injected into animals/humans. Communication through EPR spectrum. Simple spectrum in a complex biological system
Response of Symmetric Trityl (deuterated) to Oxygen • No temp. dependence: < 0.05 mG/K • Low viscosity dependence ~1mG/cP • Self quenching a potential confounding variable-- Solved with Longitudinal Relaxation Rate Imaging
Information about fluid in which reporter molecule dissolved obtained from Spectral Parameters … Standard penalty for deviation: χ2=(yi-fit(xi, aj))2 minimize this penalty by adjusting the Spectral Parameters aj e.g., spectral width spectral width Spectral parameters extracted from spectral data using Spectral/Relaxation Rate Fitting Bonus: Fitting gives parameter uncertainties
Major improvement: Synthesis of selectively deuterated OX31 d d Improves 1. Oxygen sensitivity: d DB /DB~dR/R 2. Spatial resolution for a given gradient: resolvable Dx= DB/G 3. Sensitivity
Line widths pO2 calibration Oxygen dependence of spin packet width obtained in a series of homogenous solutions of OX31: Since minimal viscosity dependence, aqueous=tissue
CW 4D IMAGE LINEWIDTH RESOLUTION A measure of the line width resolution is the distribution of linewidths from a homogeneous phantom. Here, the s of the distribution is 0.17 mT, or ~ 3 torr pO2 (8x8x8,projections in 20 minutes)
Line Width Fidelity: Agreement Between Image and Individually measured line-widths (1.6 mm) heterogeneous phantom. Side lines Approximately ±3 torr.
EPR spectral-spatial 4D imaging • CW EPR imager at 250 MHz, with a loop-gap resonator
Dimensions of the resonator (1.5 cm thick) Sensitive Region of the resonator (total of just over 2 -2.5 cm)
XY YZ Mouse Image (OX063) • PC3 tumor with 3D intensity image (Note no artifacts surrounding surface) • XY and YZ pO2 slices corresponding to the slices in the volume
Validation with Oxylite fiberoptic probe (measuring fluorescence quenching by oxygen) Oxylite probe Into tumor Stereotactic Platform For Needle Location
Adjacent tracks in areas of rapid oxygen variation agree with Oxylite
New insight into the oxygen status of tumors and tissues