Data analysis and causal inference – 2
Principles of Epidemiology for Public Health (EPID600). Data analysis and causal inference – 2. Victor J. Schoenbach, PhD home page Department of Epidemiology Gillings School of Global Public Health University of North Carolina at Chapel Hill www.unc.edu/epid600/.


Data analysis and causal inference – 2
E N D
Presentation Transcript
Principles of Epidemiology for Public Health (EPID600) Data analysis and causal inference – 2 Victor J. Schoenbach,PhD home page Department of EpidemiologyGillings School of Global Public HealthUniversity of North Carolina at Chapel Hill www.unc.edu/epid600/ Data analysis and causal inference
Causal relations and public health Many public health questions hinge on causal relations, e.g. • Does dietary fiber prevent colon cancer? • Do abstinence-only sex education programs raise the age of sexual debut? • What level of arsenic in drinking water is harmful? • Does higher patient volume reduce knee replacement complication rates? • Does male circumcision prevent HIV infection? Data analysis and causal inference
Conceptual issues in causal relations • In general we cannot “see” causal relations but must infer their existence. • “Proving” causation means creating a belief – our own and others’. • Causal inference is therefore a social process. • What we regard as “causes” depends on our conceptual framework. Data analysis and causal inference
Pre-20th century causal discoveries • Food poisoning from shellfish, pork • Plumbism from wine kept in lead-glazed pottery (Romans) • Contagion (isolation, quarantine) • Scurvy and citrus fruit (James Lind) • Scrotal cancer in chimney sweeps (Percival Pott) Data analysis and causal inference
Pre-20th century causal discoveries • Smallpox vaccination • Cowpox vaccination (Edwin Jenner) • Waterborne transmission of typhoid fever (William Budd) and cholera (John Snow) • Person-to-person transmission of measles (Peter Panum) • Puerperal fever and handwashing (Ignaz Semmelweis) Data analysis and causal inference
Rise of the germ theory • Invention of the microscope enabled direct observation of microorganisms • Seeing microbes ≠ Seeing microbes cause disease • Henle-Koch postulates for proving that a microorganism causes a disease Data analysis and causal inference
Even seeing involves inference I LQVF FRIDEMIQLQCX Data analysis and causal inference
Inference that is not always correct I LQVF FRIDEMIQLQCX Data analysis and causal inference
Inference that is not always correct van der Helm’s “Kaleidoscope Motion” (from Michael’s “Visual Phenomena & Optical Illusions”) www.michaelbach.de/ot/ www.michaelbach.de/ot/mot_feet_lin/ www.michaelbach.de/ot/mot_kaleidoscope/ Data analysis and causal inference
Henle-Koch postulates 1. The parasite must be present in all who have the disease; 2. The parasite can never occur in healthy persons; 3. The parasite can be isolated, cultured and capable of passing the disease to others Data analysis and causal inference
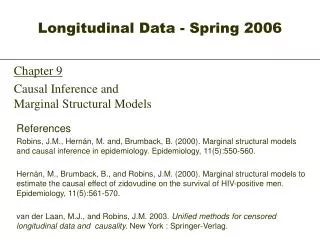
E.H. Carr – What is history? “History … is ‘a selective system’ … of causal orientations to reality.… from the infinite ocean of facts [and] … the multiplicity of sequences of cause and effect [the historian] extracts those, and only those, which are historically significant; and the standard of historical significance is his ability to fit them into his pattern of rational explanation and interpretation. Other sequences of cause and Data analysis and causal inference
E.H. Carr – What is history? effect have to be rejected as accidental, not because the relation between cause and effect is different, but because the sequence itself is irrelevant. The historian can do nothing with it; it is not amenable to rational interpretation, and has no meaning either for the past or the present.” (E.H. Carr, What is History, p. 138). Data analysis and causal inference
When to act? “All scientific work is incomplete – whether it be observational or experimental. All scientific work is liable to be upset or modified by advancing knowledge. That does not confer upon us a freedom to ignore the knowledge we already have, or to postpone the action that it appears to demand at a given time.” A.B. Hill, The environment and causation, p. 300 Data analysis and causal inference
Is cigarette smoking harmful to health? • Surgeon General's Advisory Committee on Smoking and Health, chaired by Dr. Luther Terry. Data analysis and causal inference
Surgeon General’s Advisory Committee on Smoking and Health • Long existing concern about health effects of smoking • Accumulation of scientific studies in 1950’s • Committee of the Royal College of Physicians in Britain issued a report in 1962 indicting cigarette smoking as a cause of lung cancer and bronchitis and probably of CVD • Major health problem, major industry, $$$ Data analysis and causal inference
“Criteria for causal inference” 1. Strength of the association 2. Consistency - replication 3. Specificity of the association 4. Temporality 5. Biological gradient 6. Plausibility 7. Coherence 8. Experiment 9. Analogy Data analysis and causal inference
1. Strength of the association • Is there an association? • Is there really an association? (not chance, not bias, not confounding) • Stronger associations less likely to be entirely due to confounding • How strong is strong? Data analysis and causal inference
How strong is strong? Data analysis and causal inference
2. Consistency - replication • Has this association been observed in other studies? • By other investigators? • Working independently? • With different methods? • (Problematic for one-time events) Data analysis and causal inference
3. Specificity of the association • Does what we see conform to what our conceptual model says we should see? • If we expect a specific causal relation, is that what we see? • The more accurately we define the factors, the greater the relative risk. Data analysis and causal inference
4. Temporality • In everyday life, a cause must be present before its effects, at least by an instant. • Subclinical disease states may be present long before the outcome is detected. Data analysis and causal inference
5. Biological gradient • “Dose-response” relation – if we expect one. • Often think that bias would not produce a dose-response relation. • Biological model might predict threshold and/or saturation. Data analysis and causal inference
Possible dose-response curves Incidence Incidence Saturation Threshold 0 Dose Dose 0 Data analysis and causal inference
6. Plausibility • Can we explain the relation on the basis of existing biological (psychological, social, etc.) knowledge? • Problematic for new types of causes Data analysis and causal inference
7. Coherence Does all of what we know fit into a coherent picture? • Descriptive epidemiology of the exposure and disease by person, place, and time • Related biological, economic, geographical factors Data analysis and causal inference
8. Experiment Epidemiologic experiments can provide unique evidence – exposure precedes outcome; substitute population may be valid. • Randomized trials • Quasi-experimental studies • Natural experiments Data analysis and causal inference
9. Analogy • Like plausibility, but weaker • We are readier to accept something similar to what we’ve seen in other contexts. • This criterion illustrates the point that causal inference involves getting people to change their beliefs Data analysis and causal inference
Causal inference in epidemiology and law • Decision about facts must be reached on the evidence available • Emphasis on integrity of the process of gathering and presenting information • Requirement for adequate representation of contending views Data analysis and causal inference
Epidemiology and the legal process • Use of standards of certainty for various potential consequences. • Reliance on procedural (methodological) safeguards, since facts are established only as findings of an investigatory process. • Justice (i.e., proper procedures / methodology) must be done and also seen to be done Data analysis and causal inference
Epidemiology in the courtroom • Increasingly, epidemiologists and epidemiologic data are entering the courtroom. • E.g.’s, Benedectin, silicon breast implants, environmental tobacco smoke, diesel exhaust. For more on causal inference, see the 2005 AJPH special issue on science and the law Data analysis and causal inference
What is this graph saying? 12/31/2009, B6
Why we need epidemiology We can see effects that are regular and immediate. We need epidemiology for outcomes that are rare, delayed, inconsistent, subtle, multifactorial. Role of epidemiology in public health
How to remember what you’ve learned – how to tell others 10 fundamentals of epidemiology Role of epidemiology in public health
1. Epidemiology studies populations Epidemiology is the study of health and disease in populations for the purposes of (i) understanding disease dynamics, (ii) controlling disease, and (iii) promoting health. Comparison across and within populations is the key strategy of epidemiologic inquiry. Role of epidemiology in public health
2. Populations are diverse Populations (meaningful collections of people) are diverse, heterogeneous, dynamic, and interconnected. Epidemiology depends on these qualities in order to make useful comparisons. Comparisons must not be confounded by uncontrolled diversity. Role of epidemiology in public health
3. Measures for studying populations • Counts of people – rates, proportions, and ratios, e.g., birth rate, death rate, incidence, prevalence, abortion ratio; • Distributions of characteristics of people, e.g., mean age, mean education, mean cholesterol level; • Characteristics of groups or environment, e.g., sexual networks Role of epidemiology in public health
4. Incidence Fundamental concept Rate (incidence rate, “incidence density”) or proportion (incidence proportion, cumulative incidence). Incidence rate measures the process of disease occurrence; incidence proportion measures the result of a process. Role of epidemiology in public health
5. Measurement Observation and measurement are fundamental to scientific advances. Choosing a measure – objective, conceptual model, and availability of data (technology, feasibility, and ethics). Role of epidemiology in public health
6. Error All measurement involves error. Science seeks to minimize error and to quantify it as a guide to interpreting data. Sources of error include random error (e.g., variability from sampling) and systematic error (e.g., selection bias, information bias). Role of epidemiology in public health
7. Epidemiology is mass production Collection, processing, management, and analysis of epidemiologic data (medical records, questionnaires, interviews, biological specimens, environmental measurements) involve mass production. Skillful management and quality control are key though often unadvertised components of epidemiology. Role of epidemiology in public health
8. Health and disease are processes Health and disease are complex, dynamic processes affected by multiple, interacting factors acting at multiple levels. Can be challenging to define and to measure. Interpretation must take this complexity into account but not become lost in it. Role of epidemiology in public health
9. Interpretation, inference, and action Interpretation takes account: • how data were collected • underlying conceptual framework. We are the source of our data and their spokesperson. Conclusions from data require inference and the weighing of evidence. One of the most difficult decisions is deciding when to act. Action should be accompanied by monitoring. Role of epidemiology in public health
10. Awareness and humility Breadth of awareness and humility are important assets. More factual knowledge but major public health problems and failings. Good people can make mistakes, resist new knowledge, take deplorable actions. When confronting the unfamiliar, how can we tell fact from illusion, insight from fantasy? Role of epidemiology in public health
Where have we come from, where do we need to go? Role of epidemiology in public health
Why Men Are Not Secretaries “Someone from the Guyna College called: They said Pabst beer is normal” Husband’s note on refrigerator to his wife: Role of epidemiology in public health
From A Prairie Home Companion Pretty Good Joke Book, 4th Edition The secretary was leaving the office when she saw the CEO standing by a shredder with a piece of paper in his hand. “Listen,’ said the CEO, ‘this is a very important document. Can you make this thing work?” Role of epidemiology in public health
From A Prairie Home Companion Pretty Good Joke Book, 4th Edition The secretary turned the machine on, inserted the paper, and pressed the start button. “Great,” said the CEO as his paper disappeared inside the machine. “I just need one copy.” p177 Role of epidemiology in public health
Thank you Data analysis and causal inference