Download
1 / 7
70 likes | 166 Views
Explore the latest US inflation data and trends in this informative presentation from Ed Dolan's Econ Blog. Learn about CPI inflation, seasonal adjustments, expected inflation rates, and more. Discover how inflation has evolved over the past two years and its implications on the economy. Stay informed on economic indicators to enrich your classroom discussions and enhance your understanding of macroeconomics. Access valuable insights to supplement your economics curriculum and engage students with real-world examples. Follow Ed Dolan's blog for regular updates and deepen your knowledge of economic principles.

E N D
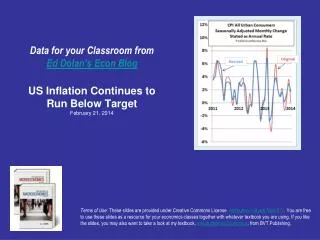
Data for your Classroom fromEd Dolan’s Econ BlogUS Inflation Continues to Run Below TargetFebruary 21, 2014 Terms of Use: These slides are provided under Creative Commons License Attribution—Share Alike 3.0 . You are free to use these slides as a resource for your economics classes together with whatever textbook you are using. If you like the slides, you may also want to take a look at my textbook, Introduction to Economics, from BVT Publishing.
CPI Inflation Continues to Run Below Target • The US consumer price index rose at a seasonally adjusted annual rate of 1.75 percent in January, 2014 • Over the past two years, inflation has trended downward • The January rate was well below the Fed’s 2 percent inflation target Posted February 21, 2014 on Ed Dolan’s Econ Blog http://dolanecon.blogspot.com
The Role of Seasonal Adjustment • Monthly data is often seasonally adjusted to remove the effects of price changes that happen at predictable times of year, such as higher gasoline prices in the summer driving season • From time to time, the BLS updates its seasonal adjustment factors • Newly revised adjustment factors show less month-to-month volatility in the seasonally adjusted CPI, compare with previously released data Posted February 21, 2014 on Ed Dolan’s Econ Blog http://dolanecon.blogspot.com
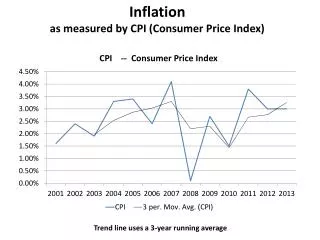
Year-on-year inflation is also trending down • Another way to eliminate seasonal factors is to look at year-on-year changes in the CPI • This chart shows both the all-items CPI and also the core CPI, which removes volatile food and energy prices • Both inflation rates have trended down over the past two years Posted February 21, 2014 on Ed Dolan’s Econ Blog http://dolanecon.blogspot.com
Expected Inflation • The Cleveland Fed uses the prices of Treasury Inflation-Protected Securities to estimate the rates of inflation expected by participants in financial markets • In mid-2013, expected inflation rates began to rise • Since late summer, expected inflation has leveled out, and remains well below the Fed’s 2 percent target Posted February 21, 2014 on Ed Dolan’s Econ Blog http://dolanecon.blogspot.com
The Bottom Line The bottom line: Despite the gradually strengthening recovery, an upside outbreak of inflation remains among the least significant risks facing the U.S. economy Posted February 21, 2014 on Ed Dolan’s Econ Blog http://dolanecon.blogspot.com Trimmed mean All Items
For more slideshows, followEd Dolan’s Econ Blog Follow @DolanEconon Twitter Click here to learn more about Ed Dolan’s Econ texts or visit www.bvtpublishing.com