Download
1 / 1
10 likes | 134 Views
Effects of Sampling and Screening Strategies in an RDD Survey Anthony M. Roman, Elizabeth Eggleston, Charles F. Turner, Susan M. Rogers, Rebecca Crow, Sylvia Tan. PROBLEM 2: COST.

E N D
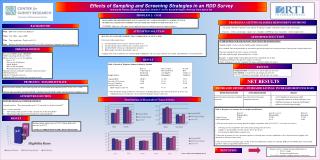
Effects of Sampling and Screening Strategies in an RDD Survey Anthony M. Roman, Elizabeth Eggleston, Charles F. Turner, Susan M. Rogers, Rebecca Crow, Sylvia Tan PROBLEM 2: COST • RDD SAMPLE FRAME INEFFICIENT DUE TO AMOUNT OF CALLING REQUIRED TO SCREEN OUT NON-RESIDENTIAL TELEPHONE NUMBERS AND HOUSEHOLDS WITHOUT SOMEONE AGED 15-35 • CONCERN: High costs will require fewer completed interviews and lower power in statistical analyses PROBLEM 3: GETTING ELIGIBLE RESPONDENT ON PHONE BACKGROUND • Age group is known to spend less time at home talking to eligible respondent requires many call attempts • Concerns: 1) Extra call attempts = higher cost; 2) Inability to EVER get some respondents = lower response rates What: RDD study conducted in Baltimore When: Sept. 2006 – August 2009 Who: Target population: People aged 15-35 Why: Measure risk behaviors and prevalence of 3 STI’s (Gonorrhea, Chlamydia and Trichonomiasis) ATTEMPTED SOLUTION • MOVE TO DUAL-FRAME SAMPLE USING COMBINATION OF LISTS & RDD • Four strata within sample frame: • List households believed to have someone aged 15-35 • List households believed NOT to have someone aged 15-35 • List households with no age information on occupants • RDD sample with all list households removed • Sampling from strata at different rates, all households in Baltimore can exist in one and only one stratum, all probabilities of selection known. ATTEMPTED SOLUTION • ALTER METHOD OF RANDOM SELECTION OF ELIGIBLE RESPONDENT • Original method: 1/n for each of n eligible people within household • New method: Increased probability of selection for person who answered screener questions if that person is eligible themselves • Screener respondent has 2/(n+1) chance of selection • All other eligible people in household 1/(n+1) chance • Example: 2 eligible people in household and screener respondent one of them • Original method gave this person ½ chance of selection • New method gave screener respondent 2/3 chance and other eligible 1/3 chance ORIGINAL DESIGN • List assisted RDD sample (GENESYS) • Address matching for advance letters • Phone interviewers screen for eligibility: • Age 15-35 • Live in city of Baltimore • Speak English • Have touch-tone phone • Parental permission when required • Random selection of eligible respondent within household • TACASI interview • $20 for 15-20 minute interview • Additional $40 for providing urine specimen by mail RESULT • Table 1: Results of Telephone Number Dialing by Stratum • Rate of Rate at which Overall • Connecting to Households had Rate • Residential Age Eligible Column 1 x • Sample Source:Households:Respondent:Column 2: • Original RDD 30.80% 31.10% 9.58% • List with 15-35 person 78.05 61.94 48.34 • List Age Unknown 62.07 41.01 25.46 • Combined lists and • RDD with lists removed 30.16 41.78 12.60 • ** The dual frame design resulted in a 31% increase in dialing efficiency and a relevant decrease in survey cost. • Additional increase in efficiency can be realized with higher reliance on the lists. RESULTS Original method: averaged 12.31 call attempts per interview. New Method: averaged 8.88 call attempts per interview. **27.9% reduction in call attempts with relevant cost savings NET RESULTS PROBLEM 1: ELIGIBILITY RATE Based on census estimates, lower than expected rate of households with someone aged 15-35 (21.3% vs. 31.6%) Concern: Bias caused by missing households, cell phone only households, higher costs due to lower eligibility rates DECREASED EFFORT = INCREASED SAVINGS; INCREASED RESPONSE RATE ATTEMPTED SOLUTION Distributions of Respondent Characteristics • REWORD ORIGINAL SCREENER QUESTION • Original question: “How many people aged 15-35 currently live in this household?” • New screener questions: • “How many people aged 36 or older currently live in this household?” • “How many people aged 15-35 currently live in this household?” • Table 3: Response rate changes due to sampling modifications • Interview Agreed to receive Returned • Response Rate:Specimen Kit:Specimen: • Original design 55.04% 84.20% 78.26% • After modifications 59.65 86.14 85.04 • The increased response rate among identified eligible respondents from 55% to 59.7% we assume to be due to: • Selecting screener respondents more often meant getting more interviews • A higher % of households received advance letters due to lists • Lists produced slightly higher response rates • 2) Increased agreement to receive specimen cup due to selecting more screener respondents as they had an increased rapport with interviewers and agreed more often. • 3) The increased rate of returning cups was due to one last modification and that was offering $100 instead of $40 to those who initially agreed to send in a cup and then failed to do so. RESULT Wording change produced rate of 31.3% of households with someone aged15-35 CLOSELY CORRESPONDS WITH CENSUS ESTIMATE! • Examine effects of sample design modifications on: • Survey weights • Estimated standard errors • Use results to optimize sampling fractions across strata NEXT STEPS *ACS = American Community Survey