Download
1 / 41
410 likes | 581 Views
Gross Domestic Product. Chapter 12.1. Objectives. Identify National Income and Product Accounts (NIPA). Explain how gross domestic product (GDP) is calculated. Explain the difference between nominal and real GDP. List the main limitations of GDP. Describe other income and output measures.

E N D
Gross Domestic Product Chapter 12.1
Objectives • Identify National Income and Product Accounts (NIPA). • Explain how gross domestic product (GDP) is calculated. • Explain the difference between nominal and real GDP. • List the main limitations of GDP. • Describe other income and output measures. • Identify factors that influence GDP.
I. National Income and Product Accounts a. National Income accounting- a system that collects macroeconomic statistics on production, income, investment, and savings.
b. Data compiled and presented in the form of NIPA i. Maintained by the US Department of Commerce ii. Data used to determine economic policies
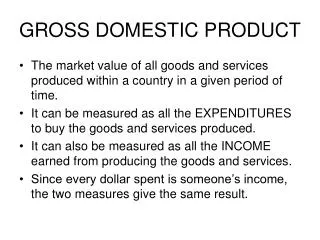
II. Gross Domestic Product a. GDP- the dollar value of all final goods and services produced within a country’s borders in a given year
i. Dollar Value-the total of the selling prices of all goods and services produced in a country in a year ii. Final goods and services- products in the form sold to consumers iii. Intermediate goods- used in the production of final goods
b. GDP includes cars made by a Japanese company in the US, not cars produced by an American company in Japan
c. Expenditure Approach i. Estimate the annual expenditures on four categories 1. consumer g and s a. durable goods- goods that last for a relatively long time, such as refrigerators, cars, and DVD players b. nondurable goods- last a short period of time, such as food, light bulbs and shoes
2. business g and s 3. government g and s 4. net exports or imports of g and s ii. Add them all together and this is the GDP d. Income Approach- add up all income in the economy i. More accurate
III. Nominal versus Real GDP a. Nominal- measured in current prices b. Real-expressed in constant, or unchanging prices
IV. Limitations of GDP a. Nonmarket activities- activities that people do on their own that are then paid for and done by someone else will show a rise in GDP even though there really is no rise
b. The underground economy- either illegal transactions or legal transactions that are not reported (paying a babysitter, paying your neighbor to mow the lawn)
c. Negative externalities- if a power plant spends money to cut down pollution, the money value is reflected in the GDP whereas the clean environment is not d. Quality of life- GDP does not measure pleasant surroundings, leisure time, personal safety
V. Other Income and Output measures a. Gross National Product- annual income earned by US owned firms and US citizens i. Does not account for depreciation- loss of the value of capital equipment that results from normal wear and tear
b. Net National Product- GNP – depreciation i. Does not account for taxes c. National Income- accounts for sales excise taxes
VI. Influences on GDP a. Aggregate Supply- the total amount of goods and services in the economy available at all possible price levels i. Price level- the average of all prices in the economy
Business Cycles 12.2
Objectives • Identify the phases of the business cycle. • Describe four key factors that keep the business cycle going. • Explain how economists forecast fluctuations in the business cycle.
I. Phases of a business cycle a. Business cycle- a period of macroeconomic expansion followed by a period of contraction.
i. Expansion- a period of economic growth as measured by a rise in GDP 1. economic growth- a steady, long-term increase in real GDP ii. Peak- the height of an economic expansion, when real GDP stops rising
iii. Contraction- a period of economic decline marked by falling real GDP 1. recession- a prolonged economic contraction 2. depression- a recession that is especially long and severe 3. stagflation- a decline in real GDP combined with a rise in the price level
iv. Trough- the lowest point in an economic contraction, when real GDP stops falling
II. What Keeps a Business Cycle Going? a. Business investment i. Expansion 1. Firms expect sales and profits to keep rising 2. They invest heavily in new plants and equipment 3. Creates additional output and jobs
ii. Contraction 1. Firms decide that they have expanded enough or demand is declining 2. They quite investing 3. capital industries slow production 4. jobs are lost and the contraction spirals downwards
b. Interest rates and credit i. Credit is used when people or firms are making large purchases ii. Low interest rates encourage expansion and creation of new jobs iii. High interest rates discourage expansion and cause lay offs and contraction
c. Consumer Expectations i. Fears of a weakening economy can cause consumers to save money for hard times and spend less ii. This, in turn causes a contraction in the business cycle
e. External Shocks i. Negative 1. disruptions of the oil supply, wars that interrupt normal trade relations, and droughts that reduce crop harvests ii. Positive 1. discovery of a large deposit of oil or minerals, a good crop harvest caused by a mix of sun and rain
III. Business Cycle Forecasting a. Leading indicators- a set of key economic variables that economists use to predict a new phase of a business cycle i. Stock market, interest rates, manufacturers’ new orders of capital goods, etc.
Economic Growth 12.3
Objectives • Analyze how economic growth is measured • Understand capital deepening and how it contributes to economic growth • Analyze how saving and investment are related to economic growth • Summarize the impact of population growth, government, and foreign trade on economic growth • Identify the causes and impact of technological progress
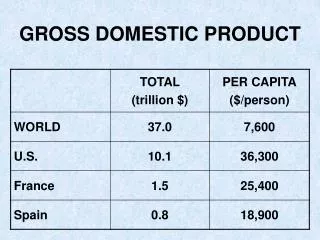
I. Measuring Economic Growth a. GDP and Population growth- b/c over time population grows, real GDP must also grow i. Real GDP per capita- GDP divided by the total population
b. GDP and Quality of Life i. Can only tell the average amount of money per person 1. cannot say how money is really distributed 2. cannot tell stress levels of people, leisure time etc.
i. GDP per capita is still a good starting point for measuring quality of life ii. Other factors- housing, longer life, education etc.
II. Capital Deepening- process of increasing the amount of capital per worker a. Effects of deepening Labor Force + Human Capital and Physical Capital | Increased labor productivity | Increased output | | Increased wages Increased labor demand
III. Saving and Investment a. Higher savings leads to higher investment, which then leads to higher amounts of capital deepening (more capital per worker)
IV. Population, Government, and Trade a. Population Growth- if pop grows while supply of capital remains constant, the amount of capital per worker shrinks i. Lower living standards ii. India has a large labor force but few capital stocks
b. Government- the more the government takes in taxes, the less savings (investment) individuals make i. If money is spent on wars, capital decreases ii. If money is spent on public goods, capital increases
c. Foreign Trade- if a deficit is created, capital value depends on what it is used for i. If used to for long term consumption, the economy will grow and capital increases ii. If used for short term consumption, the economy will not grow any faster, capital decreases
V. Technological Progress- an increase in efficiency gained by producing more output without using more inputs. a. Solow’s method of measuring Technological Progress i. Take change in real GDP, subtract physical and human capital, the remaining amount should be technological progress
b.Causes of technological progress i. Scientific Research- discovering new and improved production techniques ii. Innovation- given incentive through patents
iii. Scale of the market- large markets create more potential for profit, so more innovation is done iv. Education and Experience- more education, more progress v. Natural Resource use- need for resources forces us to innovate and create new technology