Download

1 / 21
210 likes | 364 Views
Gross Domestic Product. Chapter 12, Section 1. History. Used to think the economy would automatically correct itself Great Depression- 1929-World War II Must find a way to monitor the economy’s performance to predict downturns and try to prevent them. National Income and Product Accounts.

E N D
Gross Domestic Product Chapter 12, Section 1
History • Used to think the economy would automatically correct itself • Great Depression- 1929-World War II • Must find a way to monitor the economy’s performance to predict downturns and try to prevent them
National Income and Product Accounts • National Income Accounting: collects statistics on production, income, investment, and savings • National Income and Product Accounts (NIPA) • Used to determine economic policies
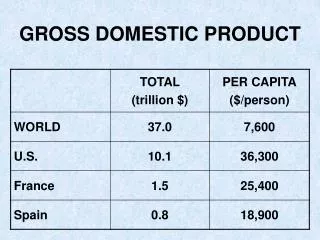
Gross Domestic Product • One of the measures included in the NIPA • The dollar value of all final goods and services produced within a country’s borders in a given year • Let’s break it down...
“Dollar value” • The total of the selling prices of all goods and services produced in a country in one calendar year added up • Products in the form sold to consumers • Notintermediate goods- used in the production of final goods “final goods and services”
“produced within a country’s borders” • Cars produced in America and sold by a Japanese company • Cars produced in Brazil and sold in America
For example: • Sarah sells her house, which was built in 1982. What year’s GDP is that house included in? • What about the realtor fees?
For example: • James buys a brand new house. Is this included in GDP? • What about the costs of the lumber, nails, windows, doors, and shingles?
Expenditure Approach • Add together the amounts spent to produce goods and services during the year • 4 categories: • Consumer goods and services • Business goods and services • Government goods and services • Net exports or imports of goods and services
Expenditure Approach: Example • Calculate this country’s GDP using the expenditure approach. • This year, the country produced: • 750 big screen televisions at $1,000 each • 500 coffee tables at $50 each • Exported 75 sofas at $250 each $81,250
Income Approach • More accurate • Add up all the incomes in the economy • The prices goods are sold for is equal to the amount of income earned by all of the people who helped, however indirectly, to produce the product
Income Approach: Example • Calculate this country’s GDP using the income approach. • This country produces houses and employs: • 2 architects at $20,000 each • 15 contractors at $18,000 each • 4 interior designers at $15,000 each $370,000
Nominal vs. Real GDP • Nominal GDP: use the current year’s prices to calculate the value of the current year’s output
Nominal vs. Real GDP • The next year, prices rise but productivity does not. This falsely inflates the GDP measure.
Nominal vs. Real GDP • To correct for this increase in prices, economists choose one year as a base year and use the prices from that year to calculate real GDP.
Limitations of GDP • Nonmarket activities: goods or services people make or do themselves • Underground economy: black market, illegal gambling, selling a car to a friend, etc. • Negative externalities: value of clean environment not counted in GDP • Quality of life: additional goods and services to not necessarily make people any happier
Influences on GDP • Aggregate supply • As price levels rise, there is an incentive for firms to increase their output (more profit) • As price levels drop, firms reduce their output (less profit) • Aggregate supply shows the relationship between prices and output supplied • How does this affect GDP?
Influences on GDP • Aggregate demand • As price levels go up and down, individuals and businesses change how much they buy • Lower price level = greater purchasing power [falling prices increase wealth and demand] • Higher price level = less goods and services demanded • How does this affect GDP?
Influences on GDP • Aggregate supply/aggregate demand equilibrium • See book: p. 308