Download
1 / 15
150 likes | 174 Views
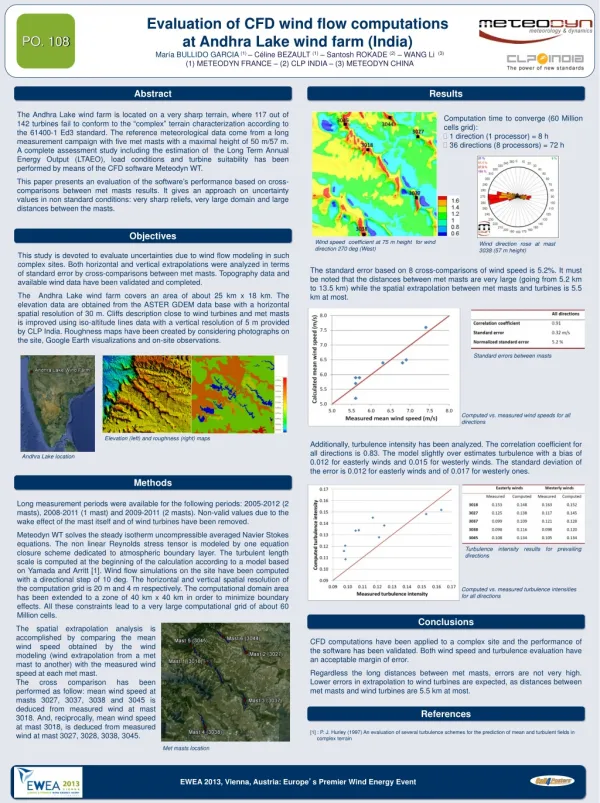
This study presents a complex approach for assessing the occurrence of dry winds and droughty spells in Bulgaria, based on temperature-humidity complexes. The paper analyzes the distribution, duration, and spatial distribution of these climate phenomena in the country.

E N D
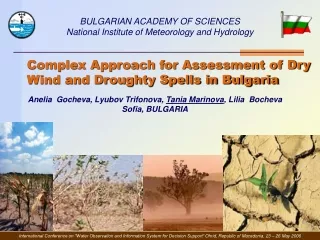
Complex Approach for Assessment of Dry Wind and Droughty Spells in Bulgaria Anelia Gocheva, Lyubov Trifonova, Tania Marinova, Lilia Bocheva Sofia, BULGARIA BULGARIAN ACADEMY OF SCIENCES National Institute of Meteorology and Hydrology International Conference on "Water Observation and Information System for Decision Support“Ohrid, Republic of Macedonia, 23 – 26 May 2006
Introduction In many regions all over the world the extreme droughts and dry wind are severe climate phenomena which occur frequently and cause great damages and losses. The way these hazardous events occur in Bulgaria is the subject of this study. The paper presents a first attempt for climatic systematization of the available meteorological data concerning the occurrence of dry winds and droughty spells on the territory of the country, assessed on the basis of Temperature – Humidity Complex (THC).
Criteria • Dry wind (t-f-v) • t 25C, f 30%, v 5 m/s • Temperature-humidity (t-f) droughty spells • t 25C, f 30%
Figure 1. Location of the meteorological stations used for investigation on the dry winds and droughty spells in Bulgaria Meteorological Data Period: 1961–2000 Stations: 249 All available t-f information was carefully examined. Part of them are inappropriate for the researchbecause of closure (especially after 1990) or movements, frequent interruptions, short available data periods, lack of data in the warm season. In addition dry winds do not occur in many costal and mountain stations. The total number of stations was reduced: 150 = 130(basic)+ 20(subsidiary–with less than 25 years period)
General characteristics Table 1 Distribution (in %) of the dry winds* by duration and months Dry winds (1961-2000): about 150 cases of dry winds, registered in more than 50 stations, with total duration above 550 days. The dry wind season is April – September with greatest frequency of the phenomenon in August and July. The cases with duration 3 – 4 days prevail but events with duration 6 – 8 (even 9) days are also registered. An increase of the events with duration 4 – 5 days and a slide shift of the dry wind season from April – September to May – October is observed on the background of the tendency of increasing of total annual number of dry winds in the recent years.
Table 2 Distribution (in %) of the t–f droughty spells* in North (N) and South (S) Bulgaria Droughty spells (1961-2000): about 2600cases observed during more than 10 300days. The season of t–f droughty spells is April - October but while in North Bulgaria about 25% of the cases are observed in August and July, for the territory of South Bulgaria this figure is about 40%. Besides, about 2/3 of all cases are registered on the territory of south part of the country. The values of observed maximum duration of droughty spells in North and South Bulgaria are again in favor of the South in proportion 9 : 15 based on (1961-1990) data period and 11 : 17 during the last decade (1991–2000).
Figure 2. Distribution of dry winds and t – f droughty spells by years A tendency of increasing in total annual number of t – f droughty spells (DS) can be seen during the last decades althoughnot so expressed like in the field of dry winds (DW). The smooth curves on Fig. 2 (based on relative frequencies) represent polynomials of second (DS) and third (DW) order and the 95% confidence intervals are shown by dash lines.
Statistical extrapolation Statistical extrapolation was carried out using Fisher-Tippet type II function. Dry winds About 10 to 12 events annually can be expected on the territory of the country at least once in 30 and 50 years. Droughty spells The number of consecutive days with t-f droughty conditions referring to the same return periods are about 12 – 15 for North and 25 – 30 for South Bulgaria. Figure 3. Number of dry winds and days with t–f droughty spells extrapolated by means of Fisher-Tippet type II function
Spatial distribution Dry winds The spatial distribution of the dry winds in Bulgaria in their capacity of climatic anti-resources is analyzed using an effective method, applied in climatic aspect for assessment of climatic resources (Kobysheva, Ilina, 2001). Figure 4. Risk of dry winds by administrative districts in Bulgaria The obtained results show as regions mostly in danger the districts of Burgas and Pernik followed by the districts of Yambol and Kardjali, Sliven, Kyustendil and Blagoevgrad, etc.
Droughty (t - f) conditions The existing correlation between D and f14s, revealed on the basis of hourly synchronous air temperature and relative humidity records foran approximately 10-years period (1960–1968) is used. It is analytically presented by means of Chebishev polynomials (1) Figure 6. Regions in Bulgaria with extreme t – f droughty spells (t25C, f30%) The obtained results are used for revealing the regions at greatest risk of extreme t–f droughty spells (Struma river valley, Thracian lowland, Western&Central Danube plain) (1)
Combined (tfwr) conditions The distribution of t – f droughty spells over territory follows in general the air temperature spatial peculiarities. The rainless periods (wr) have some own typical territorial specialities. The regions at greatest risk are those subjected to a greatest extent to the combined influence of the prolonged radiation overheating as well as of the prolonged lack of precipitation, in their complex interaction. Figure 8. Risk of both extreme rainless periods and t-f droughty spells by districts These regions are determined juxtaposing the combined t–f–wr effect by districts using the methodology of (Kobysheva, N., O. Ilina, 2001) and equal weights for t–f and wr. According to the obtained results, the combined temperature-humidity and rainless influence turns out to be extremely unfavourable in the districts of Blagoevgrad and Haskovo, followed by the district of Kardjali, these ones of Yambol, Smolyan and Kyustendil, etc.
Droughty spells • weather • (2600 cases, 10300 days) • mean air temperature about 32C • maximum air temperature 37C (till 44C on some places) • mean deficit of air humidity about 35 mb (between 32 and 40 mb) • maximum deficit above 50mb (and even more) • mean wind velocity about 2 – 4 m/s (or calm) and maximum wind velocity about 20 m/s. Figure9. General meteorological conditions during dry winds and droughty spells by administrative districts • mean air temperature about 32C • maximum air temperature till 43C • mean deficit about 35 mb, maximum deficit about 30 – 40 mb (even above 50 mb again) • mean wind velocity is about 6 – 7 m/s in western and 8 – 9 m/s in eastern part of the country; • the maximum wind velocity is about 12 – 17 m/s (West BG) and 17 – 21 m/s (East BG) Dry wind weather (150 cases, 550 days)
Typical synoptic situations Figure 11a Satellite Image 14.08.2000 12:00 IR Figure12a Satellite Image 21.08.2000 12:00 IR Combined situations:sometimes lead to extreme cases of droughty spells prolonging up to 8-10 days or even more. Example of typical combination of two synoptic situations is the period from 11.08 till 23.08.2000. More detailes - in Climatological Analysis of the Synoptic Situations Causing Dry Wind and Droughty Spells in Bulgaria by Trifonova, L, A.Gocheva, T.Marinova,L. Bocheva (FP-044, BALWOIS 2006). Figure 11b Geopotential height [dm] on 1000 hPa (14.08.2000 NCEP data) Figure 12b Geopotential height [dm] on1000 hPa (21.08.2000 NCEP data) Figure 11c Geopotential height [dm] on 500 hPa (14.08.2000 NCEP data) Figure 12c Geopotential height [dm] on 500 hPa ( 21.08.2000 NCEP data)
During the last decade of the 20-th century the droughty spells, as well as the dry wind periods are increased and the obtained results confirm the conclusion for changes in weather conditions in the recent decades and increasing of the climate extreme events.
Thank you for your attention!