Download
1 / 10
100 likes | 260 Views
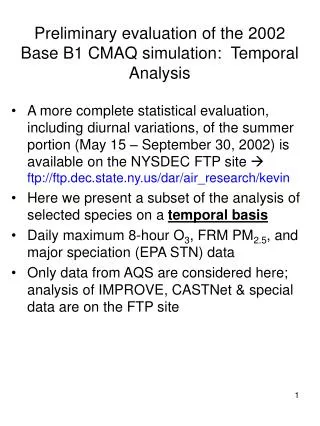
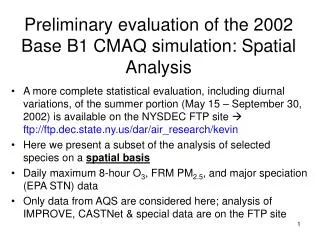
Preliminary evaluation of the 2002 Base B1 CMAQ simulation: Spatial Analysis. A more complete statistical evaluation, including diurnal variations, of the summer portion (May 15 – September 30, 2002) is available on the NYSDEC FTP site ftp://ftp.dec.state.ny.us/dar/air_research/kevin

E N D
Preliminary evaluation of the 2002 Base B1 CMAQ simulation: Spatial Analysis • A more complete statistical evaluation, including diurnal variations, of the summer portion (May 15 – September 30, 2002) is available on the NYSDEC FTP site ftp://ftp.dec.state.ny.us/dar/air_research/kevin • Here we present a subset of the analysis of selected species on a spatial basis • Daily maximum 8-hour O3, FRM PM2.5, and major speciation (EPA STN) data • Only data from AQS are considered here; analysis of IMPROVE, CASTNet & special data are on the FTP site
Daily maximum 8-hour average O3 witha minimum observed threshold of 40 ppb at 208 SLAMS/NAMS sites across the OTR and Virginia: (A) observed averages, (B) root mean square error (RMSE), and (C) mean bias (MB=P-O). At least 10 days were required for displaying the statistics at a given site. Data from the July 6-9 period are excluded since they may be affected by the Canadian forest fires.
Daily maximum 8-hour average O3witha minimum observed threshold of 60 ppb at 208 SLAMS/NAMS sites across the OTR and Virginia: (A) observed averages, (B) root mean square error (RMSE), and (C) mean bias (MB=P-O). At least 10 days were required for displaying the statistics at a given site. Data from the July 6-9 period are excluded since they may be affected by the Canadian forest fires.
Daily average FRM PM2.5 mass at 257 SLAMS/NAMS sites across the OTR and Virginia: (A) observed averages, (B) root mean square error (RMSE), and (C) mean bias (MB=P-O). At least 10 days were required for displaying the statistics at a given site, and only those days when the observed and predicted mass agreed to within a factor of 25 are included. Data from the July 6-9 period are excluded since they may be affected by the Canadian forest fires.
Daily average SO4 mass at 49 EPA/STN sites across the OTR and Virginia: (A) observed averages, (B) root mean square error (RMSE), and (C) mean bias (MB=P-O). At least 10 days were required for displaying the statistics at a given site, and only those days when the observed and predicted mass agreed to within a factor of 25 are included. Data from the July 6-9 period are excluded since they may be affected by the Canadian forest fires.
Daily average NO3 mass at 49 EPA/STN sites across the OTR and Virginia: (A) observed averages, (B) root mean square error (RMSE), and (C) mean bias (MB=P-O). At least 10 days were required for displaying the statistics at a given site, and only those days when the observed and predicted mass agreed to within a factor of 25 are included. Data from the July 6-9 period are excluded since they may be affected by the Canadian forest fires.
Daily average NH4 mass at 49 EPA/STN sites across the OTR and Virginia: (A) observed averages, (B) root mean square error (RMSE), and (C) mean bias (MB=P-O). At least 10 days were required for displaying the statistics at a given site, and only those days when the observed and predicted mass agreed to within a factor of 25 are included. Data from the July 6-9 period are excluded since they may be affected by the Canadian forest fires.
Daily average EC mass at 49 EPA/STN sites across the OTR and Virginia: (A) observed averages, (B) root mean square error (RMSE), and (C) mean bias (MB=P-O). At least 10 days were required for displaying the statistics at a given site, and only those days when the observed and predicted mass agreed to within a factor of 25 are included. Data from the July 6-9 period are excluded since they may be affected by the Canadian forest fires.
Daily average OM (=1.8×blank-corrected OC) mass at 49 EPA/STN sites across the OTR and Virginia: (A) observed averages, (B) root mean square error (RMSE), and (C) mean bias (MB=P-O). At least 10 days were required for displaying the statistics at a given site, and only those days when the observed and predicted mass agreed to within a factor of 25 are included. Data from the July 6-9 period are excluded since they may be affected by the Canadian forest fires.
Daily average soil/crustal mass at 49 EPA/STN sites across the OTR and Virginia: (A) observed averages, (B) root mean square error (RMSE), and (C) mean bias (MB=P-O). At least 10 days were required for displaying the statistics at a given site, and only those days when the observed and predicted mass agreed to within a factor of 25 are included. Data from the July 6-9 period are excluded since they may be affected by the Canadian forest fires.