Download
1 / 33
330 likes | 493 Views
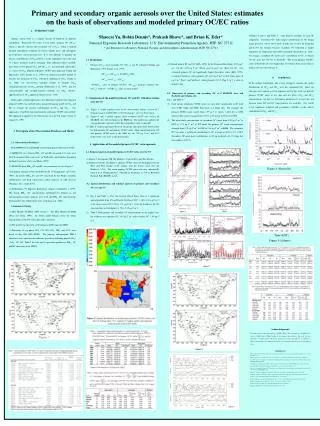
Preliminary Evaluation of the June 2002 Version of CMAQ Brian Eder Shaocai Yu Robin Dennis Jonathan Pleim Ken Schere Atmospheric Modeling Division* National Exposure Research Laboratory Environmental Protection Agency RTP, NC 27711 * On assignment from Air Resources Laboratory, NOAA.

E N D
Preliminary Evaluation of the June 2002 Version of CMAQ Brian Eder Shaocai Yu Robin Dennis Jonathan Pleim Ken Schere Atmospheric Modeling Division* National Exposure Research Laboratory Environmental Protection Agency RTP, NC 27711 * On assignment from Air Resources Laboratory, NOAA
CMAQ 2002 “Base” Version Configuration - SAPRC99 gas-phase chemistry - BEIS 3.09 biogenic emissions - AE3 aerosol module
Spatial Domain • 32 km grid resolution • 22,072 grid cells • Temporal Domain - 1- 14 July, 1999
Species, Metrics and Networks O3 Hourly, max 1-hr, max 8-hr (AIRS) SO2 Mean weekly (CASTNet) SO4 Mean weekly (CASTNet), Mean 24-hr (IMPROVE) NO3 Mean weekly (CASTNet), Mean 24-hr (IMPROVE) HNO3 Mean weekly (CASTNet) PM2.5 Mean 24-hr (IMPROVE) OMC Mean 24-hr (IMPROVE) EC Mean 24-hr (IMPROVE) NH4Mean weekly (CASTNet)
AIRSAerometric Information Retrieval System Hourly data for each of the 14 days 1,032 Stations234,384 Obs O3
IMPROVEInteragency Monitoring of PROtected Visual Environments 24-hr means for: 3, 7, 10, 14 July 50 Stations 200 Observations SO4 NO3 PM2.5 OMC EC
CASTNetClean Air Status and Trends Network Weekly means for 6 –13 July 59 Stations, 59 Observations SO2 SO4 HNO3 NH4
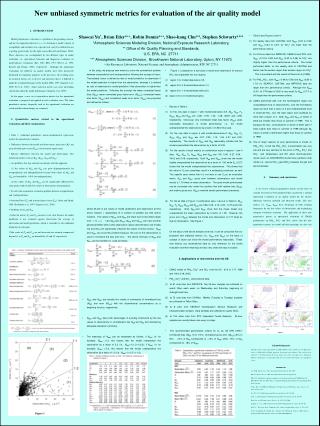
Statistics - Errors Normalized Mean Error Root Mean Square Error Mean Absolute Gross Error Mean Normalized Gross Error
Statistics - Biases Mean Bias Mean Normalized Bias Mean Fractionalized Bias Normalized Mean Bias
Ozone - Hourly CMAQ = 22.0 + 0.68 OBS • CMAQPerformance • - Biases positive and • generally small • MNB, MNGE inflated due to • small hourly obs.
Ozone - Max 1-hr CMAQ = 28.0 + 0.67 OBS • CMAQ Performance • - Biases smaller, still positive • - Errors smaller • MNB, MNGE closer to • other statistics
Ozone - Max 8-Hr CMAQ = 24.7 + 0.71 OBS • CMAQ Performance • Biases positive, smaller than • hourly, larger than max 1-hr • - Errors generally smaller
Daily Boxplots Ozone - Hourly Observations increase from 1–9 July, then decreases from 10 -12, then increase thru 14. Simulations increase from 1–6 July, decrease on 7 and again on the 10 and 11, then increase thru 14.
Daily Boxplots Ozone Difference - Hourly - CMAQ - AIRS Biases are positive on all days. Largest biases occur on 5 and 6 July Smallest occur on 1, 10 and 11 July
Daily Boxplots Ozone - Max 1-Hr Observations increase from 1–8 July, then decreases from 10 -11, then increase thru 14. Simulations increase from 1–6 July, decrease on 7 and again on the 10 and 11, then increase thru 14.
Daily Boxplots Ozone Differences - Max 1-Hr - CMAQ - AIRS Biases are again positive on all days. Largest biases occur on 5 and 6 July Smallest occur on 1, 10 and 11 July
Daily Boxplots Ozone - Max 8-Hr
Daily Boxplots Ozone - Max 8-Hr - CMAQ - AIRS
Hourly Boxplots Ozone • Diurnal pattern is well • replicated by the model • morning minimum (11 - 12 GMT) • afternoon maximum (20 - 21 GMT)
Hourly Boxplots • Ozone CMAQ - AIRS • Biases are always positive • Biases smallest in pm when • atmosphere is well mixed.
SO4 - 24-Hr mean - IMPROVE CMAQPerformance - Most simulations within 2:1 - Biases are positive and small - Errors are also small - Results better in eastern US
SO4 - Week mean - CASTNet CMAQ = 0.46 + 1.03 OBS CMAQ Performance - Most simulations within 2:1 - Biases still positive and small - Errors still small - Results better in eastern US
NO3 • - 24-Hr mean • - IMPROVE CMAQPerformance - Biases are negative and large - Errors are also large - Few simulations within 2:1
HNO3 - Week mean - CASTNet CMAQPerformance - Most simulations within 2:1 - Biases positive and large - MNB, MNGE inflated due to small observed concentrations
NH4 - Week mean - CASTNet CMAQ Performance - Almost all simulations within 2:1 - Biases are positive and large - Errors are also large
PM2.5 • - 24-Hr mean • - IMPROVE CMAQ Performance - Most simulations within 2:1 - Biases are positive and large - Errors are also large
OMC - 24-Hr mean - IMPROVE CMAQ Performance - Majority simulations within 2:1 - Biases are positive and large - Errors are also rather large`
EC - 24-Hr mean • - IMPROVE CMAQPerformance - Majority simulations within 2:1 - Biases are small and mixed - Errors are large
SO2 - Week mean - CASTNet CMAQPerformance - Biases are positive and very large - Errors are also very large
Evaluation Summary CMAQ varies in its ability to simulated air concentrations of the nine species - correlations range from ~ 0.55 (EC, OMC) to ~ 0.90 (SO4) - NME range from ~ 25% (O3) to over 100% (HNO3, SO2) generally over-predicts - biases are positive (except NO3, EC) and for some species large performs better for O3 and SO4 than other species
Contacts: Brian K. Eder email: eder@hpcc.epa.gov