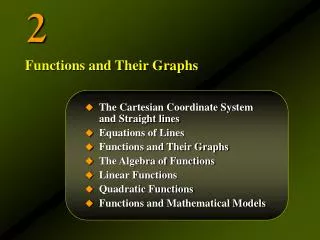
Graphs & Linear Equations
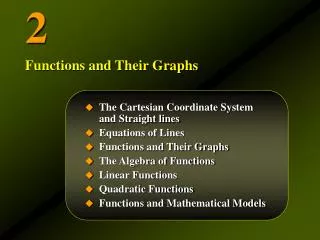
Y. Graphs & Linear Equations. y=mx+b. X. Example of a Linear Function. Y. 77. •. (11,77). A Dog’s Human’s Equivalent Age. y=f(x)=7x. 35. •. (5,35). 21. •. (3,21). X. (0,0). 3 5 11. A Dog’s Actual Age. Major Elements of Graphing Lines. • Graphing Ordered Pairs

Graphs & Linear Equations
E N D
Presentation Transcript
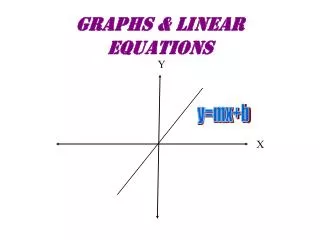
Y Graphs & Linear Equations y=mx+b X
Example of a Linear Function Y 77 • (11,77) A Dog’s Human’s Equivalent Age y=f(x)=7x 35 • (5,35) 21 • (3,21) X (0,0) 3 5 11 A Dog’s Actual Age
Major Elements of Graphing Lines • Graphing Ordered Pairs • Graphing Equations • Linear Equations • Slope & Equations • Finding Equations of Lines • Fitting Equations to Lines • Parallel & Perpendicular Lines
Y (X,Y) (4,3) • A Point X (X,Y) is called an Ordered Pair The X value or X Coordinate is the location of a point in the X direction The Y value or Y Coordinate is the location of a point in the Y direction
Y (X,Y) (4,2) • How to Graph a Point 321 X -4-3-2-1 0 1 2 3 4 X is the distance along the x=axis Y is the distance along the y=axis Y 3210 HINT: Think of the x-axis as the Number Line X -1 -4-3-2-1 0 1 2 3 4 -2 HINT: Think of the y-axis a vertical Number Line
Important Vocabulary for Graphs The Graph itself is called the x-y plane (ie. Plane surface) or The Coordinate Plane or Cartesian Coordinate Plane after Renee Descartes Y y-axis 2nd Quadrant 1st Quadrant (+X,+Y) (-X,+Y) X x-axis (-X,-Y) (+X,-Y) 3rd Quadrant 4th Quadrant Quadrants start with Positive X & Y and go Counter Clockwise
Graphing Linear Equations(Find 3 Domain & Range Points) First Degree Equations are Lines (y=mx+b) and you calculate 3 (X,Y) values Make sure the points line up on a x-y graph and connect the dots.
RECALL X-Domain & Y-Range Graphing Lines is just like finding the Range of 3 Domain Points:(Substitute each Domain value into the equation) y = 2x-7 when the Domain is {-2, 0, 2} f(-2) = 2•(-2) -7 = -4 -7 = -11 (-2,-11) f(0) = 2•(0) -7 = 0 -7 = -7 (0,-7) f(2) = 2•(2) -7 = 4 -7 = -3 (2,-3) Answer: RANGE: {-11, -7, -3}
Practice Finding 3 PointsGiven a Linear Equation Find any 3 (X,Y) points for the following equations: y=5x y=4x-5 y=3x+1 (Hint: Try x=0)
Sample Solutions x y = 5x 0 0 5 10 x y = 4x-5 x y = 3x+1
Now Graph the 3 Points x y = 5x 0 0 5 10 • (2,10) • (1,5) • (0,0)
What is Intercept in Math? Y X An Intercept is the coordinate where a line crosses the x or y axis
Using X&Y Intercepts to Graph a Line Y y-axis The Y intercept is the y coordinate (where a line crosses the y axis). • (0,2) • (3,0) X x-axis The X intercept is the x coordinate (where a line crosses the x axis).
Name the X&Y Intercepts Y y-axis • (0,2) • (3,0) X x-axis
Name the X&Y Intercepts Y y-axis • (0,2) • X x-axis (-2,0)
Name the X&Y Intercepts Y y-axis X x-axis
Name the X&Y Intercepts Y y-axis X x-axis
What is the value of x at the y intercept? What is the value of Y at the x-intercept? Y y-axis X x-axis
Graph Linear Eq. Graph y = 2x - 6 using x&y intercepts X Y = 2x - 6 1st Make x-y table Y y-axis X x-axis
Graph Linear Eq. Graph y = 2x - 6 using x&y intercepts X Y = 2x - 6 0 -6 1st Make x-y table 2nd Set x = 0 and solve for y Y y-axis X x-axis • (0,-6)
Graph Linear Eq. Graph y = 2x - 6 using x&y intercepts X Y = 2x - 6 0 -6 0 1st Make x-y table 2nd Set x = 0 and solve for y 3rd Set y = 0 and solve for x Y y-axis • (3,0) X x-axis • (0,-6)
Graph Linear Eq. Graph y = 2x - 6 using x&y intercepts X Y = 2x - 6 0 -6 0 1st Make x-y table 2nd Set x = 0 and solve for y 3rd Set y = 0 and solve for x 4th Plot these 2 points and draw line Y y-axis • (3,0) X x-axis • (0,-6)
Graph Linear Eq. Graph y = 2x - 6 using x&y intercepts X Y = 2x - 6 0 -6 0 4 2 1st Make x-y table 2nd Set x = 0 and solve for y 3rd Set y = 0 and solve for x 4th Plot these 2 points and draw line 5th Use 3rd point to check Y y-axis • (4,2) • (3,0) X x-axis • (0,-6)
Graphing Horizontal & Vertical Lines This line has a y value of 4 for any x-value. It’s equation is y = 4(meaning y always equals 4) Y y-axis X x-axis
Graphing Horizontal & Vertical Lines This line has a x value of 1 for any y-value. It’s equation is x = 1(meaning x always equals 1) Y y-axis X x-axis
The Equation of a Vertical Line is X=Constant Y y-axis x = 1 X x-axis
The Equation of a Horizontal Line is Y=Constant Y y-axis y = 3 X x-axis
Graph the following lines Y = -4 Y = 2 X = 5 X = -5 X = 0 Y = 0
Answers x = -5 x = 5 Y y-axis X x-axis
Answers Y y-axis y = 2 X x-axis y = -4
Answers Y y-axis y = 0 X x-axis x = 0
SLOPE = NEGATIVE-DOWN POSITIVE-UP Slope is a measure of STEEPNESS
The Symbol forSLOPE = m NEG. Slope is -m POS. Slope is +m Think of m for Mountain
SLOPE = (6,4) 4 • 3 (3,2) 2 • 1 (0,0) 2 1 3 4 5 6 How much does this line rise? How much does it run?
2 SLOPE = 3 (6,4) 4 • 3 (3,2) 2 • 1 (0,0) 2 1 3 4 5 6 How much does this line rise? How much does it run? 2 3
m=SLOPE = x2y2 (6,4) 4 • x1y1 3 (3,2) 2 • 1 (0,0) 2 1 3 4 5 6
Switch points and calculate slopeMake (3,2) (x2,y2) & (6,4) (x1,y1) (x2,y2)(6’4) (x1,y1)(6,4) • • (x1,y1)(3,2) (x2,y2)(3,2) • •
Recalculation with points switched (x1,y1)(6,4) • (x2,y2)(3,2) • Same slope as before
It doesn’t matter what 2 points you choose on a linethe slope must come out the same
Keeping Track of Signs When Finding The Slope Between 2 Points • Be Neat & Careful • Use (PARENTHASES) • Double Check Your Work as you Go • Follow 3 Steps
3 Steps for finding the Slope of a line between 2 Points(3,4)&(-2,6) 1st Step: Write x1,y1,x2,y2 over numbers 2nd Step: Write Formula and Substitute x1,x2,y1,y2 values. 3rd Step: Calculate & Simplify x1 y1 x2 y2 (3,4) & (-2,6)
Find the Slopes of Lines containing these 2 Points 1. (1,7) & (5,2) 2. (3,5) & (-2,-8) 3. (-3,-1) & (-5,-9) 4. (4,-2) & (-5,4) 5. (3,6) & (5,-5) 6. (1,-4) & (5,9)
ANSWERS 1. (1,7) & (5,2) 2. (3,5) & (-2,-8) 3. (-3,-1) & (-5,-9) 4. (4,-2) & (-5,4) 5. (3,6) & (5,-5) 6. (1,-4) & (5,9)
Review Finding the Slopes of Lines Given 2 Points 1st Step: Write x1,x2,y1,y2 over numbers 2nd Step: Write Formula and Substitute x1,x2,y1,y2 values. 3rd Step: Calculate & Simplify NOTE: Be Neat, Careful, and Precise and Check your work as you go..
Negative Slope Is Down the Hill Positive Slope Is Up the Hill NO Slope Vertical Drop ZERO SlopeHorizontal
NO Slope Vertical Drop ZERO SlopeHorizontal
Equations of a Line There are 3 Forms of Line Equations • Standard Form: ax+by=c • Slope Intercept Form: y=mx+b • Point-Slope Form y-y1=m(x-x1) All 3 describe the line completely but are used for different purposes. You can convert from one form to another.
Converting fromStandard Form: ax+by=cto Slope Intercept Form JUST SOLVE FOR Y Slope Intercept Form: y=mx+b
Slope Intercept Form: y=mx+b The great thing about this form is b is the y-intercept. This makes graphing a line incredibly easy. Check it out. If The y intercept is +1 (0,1) • Almost a free point on graph