Download
1 / 1
10 likes | 127 Views
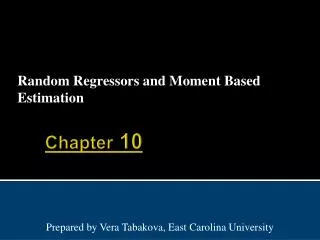
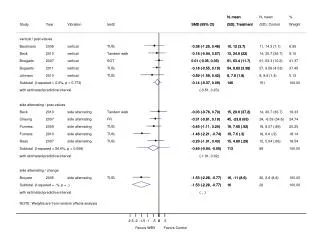
This meta-analysis explores the efficacy of vibration therapy on functional mobility in various populations. The data includes results from multiple studies assessing vertical and side-alternating vibrations through various mobility tests such as Tandem Walk and Timed Up and Go (TUG). Findings indicate varying effects on mobility outcomes, with some treatments exhibiting significant improvements while others showed negligible differences. This comprehensive review elucidates the potential benefits and limitations of vibration therapy in enhancing mobility, guiding future clinical applications.

E N D
N, mean N, mean N, mean % Study Year Vibration test2 SMD (95% CI) SMD (95% CI) (SD); Treatment (SD); Treatment (SD); Control Weight vertical / post-values Bautmans 2005 vertical TUG -0.38 (-1.25, 0.48) -0.38 (-1.25, 0.48) 10, 12 (3.7) 10, 12 (3.7) 11, 14.3 (7.1) 6.95 Beck 2010 vertical Tandem walk -0.18 (-0.94, 0.57) -0.18 (-0.94, 0.57) 13, 24.9 (22) 13, 24.9 (22) 14, 30.7 (36.7) 9.10 Boegarts 2007 vertical SOT 0.01 (-0.35, 0.36) 0.01 (-0.35, 0.36) 61, 63.4 (11.7) 61, 63.4 (11.7) 61, 63.3 (10.2) 41.37 Bogaerts 2011 vertical TUG -0.18 (-0.55, 0.19) -0.18 (-0.55, 0.19) 54, 8.83 (3.38) 54, 8.83 (3.38) 57, 9.56 (4.53) 37.45 Johnson 2010 vertical TUG -0.59 (-1.59, 0.42) -0.59 (-1.59, 0.42) 8, 7.8 (1.8) 8, 7.8 (1.8) 8, 8.8 (1.4) 5.13 Subtotal (I-squared = 0.0%, p = 0.773) -0.14 (-0.37, 0.09) -0.14 (-0.37, 0.09) 146 146 151 100.00 with estimated predictive interval . . (-0.51, 0.23) side alternating / post-values Beck 2010 side alternating Tandem walk -0.03 (-0.76, 0.70) -0.03 (-0.76, 0.70) 15, 29.6 (37.2) 15, 29.6 (37.2) 14, 30.7 (36.7) 18.33 Cheung 2007 side alternating FR -0.31 (-0.81, 0.19) -0.31 (-0.81, 0.19) 45, -23.8 (63) 45, -23.8 (63) 24, -6.59 (34.6) 24.74 Furness 2009 side alternating TUG -0.45 (-1.11, 0.20) -0.45 (-1.11, 0.20) 19, 7.65 (.92) 19, 7.65 (.92) 18, 8.07 (.89) 20.25 Furness 2010 side alternating TUG -1.48 (-2.21, -0.74) -1.48 (-2.21, -0.74) 19, 7.6 (.3) 19, 7.6 (.3) 18, 8.6 (.9) 18.14 Rees 2007 side alternating TUG -0.29 (-1.01, 0.43) -0.29 (-1.01, 0.43) 15, 4.89 (.29) 15, 4.89 (.29) 15, 5.04 (.66) 18.54 Subtotal (I-squared = 56.6%, p = 0.056) -0.49 (-0.94, -0.05) -0.49 (-0.94, -0.05) 113 113 89 100.00 . with estimated predictive interval . (-1.91, 0.92) side alternating / change Bruyere 2005 side alternating TUG -1.53 (-2.28, -0.77) -1.53 (-2.28, -0.77) 16, -11 (8.6) 16, -11 (8.6) 20, 2.6 (8.8) 100.00 Subtotal (I-squared = .%, p = .) -1.53 (-2.28, -0.77) -1.53 (-2.28, -0.77) 16 16 20 100.00 . with estimated predictive interval . (., .) NOTE: Weights are from random effects analysis -2.5 -2 -1.5 -1 -.5 0 0 .5 Favors WBV Favors Control