Download
1 / 7
70 likes | 144 Views
Learn how to make a histogram with the provided dataset and find the minimum, median, maximum, Q1, and Q3. Follow step-by-step instructions for visualizing the data distribution effectively.

E N D
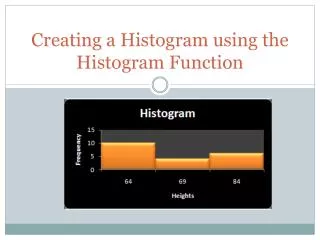
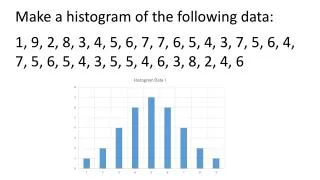
Make a histogram of the following data: 1, 9, 2, 8, 3, 4, 5, 6, 7, 7, 6, 5, 4, 3, 7, 5, 6, 4, 7, 5, 6, 5, 4, 3, 5, 5, 4, 6, 3, 8, 2, 4, 6
1, 2, 2, 3, 3, 3, 3, 4, 4, 4, 4, 4, 4, 5, 5, 5, 5, 5, 5, 5, 6, 6, 6, 6, 6, 6, 7, 7, 7, 7, 8, 8, 9
Min Median Max Q1 Q3 1, 2, 2, 3, 3, 3, 3, 4, 4, 4, 4, 4, 4, 5, 5, 5, 5, 5, 5, 5, 6, 6, 6, 6, 6, 6, 7, 7, 7, 7, 8, 8, 9
Min Median Max Q1 Q3 1, 2, 2, 3, 3, 3, 3, 4, 4, 4, 4, 4, 4, 5, 5, 5, 5, 5, 5, 5, 6, 6, 6, 6, 6, 6, 7, 7, 7, 7, 8, 8, 9
Min Median Max Q1 Q3 1, 2, 2, 2, 3, 3, 3, 3, 3, 3, 4, 4, 4, 4, 4, 4, 4, 5, 5, 5, 5, 5, 5, 6, 6, 6, 6, 7, 7, 7, 8, 8, 9
Min Median Max Q1 Q3 1, 2, 2, 3, 3, 3, 4, 4, 4, 4, 5, 5, 5, 5, 5, 6, 6, 6, 6, 6, 6, 6, 7, 7, 7, 7, 7, 7, 8, 8, 8, 8, 9
Min Max Median Q1 Q3 1, 2, 2, 2, 2, 2, 3, 3, 3, 3, 4, 4, 4, 4, 4, 4, 5, 5, 5, 5, 6, 6, 6, 6, 6, 6, 7, 7, 8, 8, 8, 8, 9