Introduction to Data Analytics Software Installation and Setup
This session of ITWS-4963/ITWS-6965, led by Peter Fox on January 24, 2014, focuses on installing and setting up essential data analytics software. We will cover software installation such as Gnu R, R Studio, Scipy, Numpy, MATLAB, and Anaconda, with guidance on exploring data using various tools. Students will learn to import and manipulate datasets, visualize data through plotting, and familiarize themselves with data technology tools. The goal is to equip learners with the skills to navigate complex data environments effectively.

Introduction to Data Analytics Software Installation and Setup
E N D
Presentation Transcript
Relevant software and getting it installed. Peter Fox Data Analytics – ITWS-4963/ITWS-6965 Week 1b, January 24, 2014
Admin info (keep/ print this slide) • Class: ITWS-4963/ITWS 6965 • Hours: 12:00pm-1:50pm Tuesday/ Friday • Location: SAGE 3101 • Instructor: Peter Fox • Instructor contact: pfox@cs.rpi.edu, 518.276.4862 (do not leave a msg) • Contact hours: Monday** 3:00-4:00pm (or by email appt) • Contact location: Winslow 2120 (sometimes Lally 207A announced by email) • TA: Lakshmi Chenicheri chenil@rpi.edu • Web site: http://tw.rpi.edu/web/courses/DataAnalytics/2014 • Schedule, lectures, syllabus, reading, assignments, etc.
Today • Install application software • Get some data and read, explore, etc. • Install data technology and related software
Gnu R • R Studio – see R-intro.html in manualshttp://www.rstudio.com/ide/download/ • Manuals - http://cran.r-project.org/doc/manuals/ • Libraries – at the command line – library(), or select the packages tab, and check/ uncheck as needed • http://cran.r-project.org/doc/manuals/R-lang.html
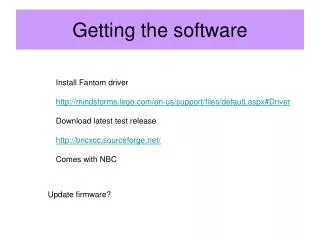
Scipy/numpy/ iPython (NB) • Windows/Linux • http://scipy.org/install.html • If you have a Mac • Anaconda – http://continuum.io/downloads (preferred) • Use Launcher to install Spyder (and iPQt) • Do you have macports installed? ‘$ which port’ • No? (sorry – ask me for details…) • Install Xcode (from http://developer.apple.com/download - you will need to register - academic) • http://www.macports.org/install.php • Also see individual packages on the install page.. • http://scipy.org/getting-started.html
Matlab • http://dotcio.rpi.edu/services/software-labs • Student version • License works within RPI network, so may have to use VPN if outside • http://mathesaurus.sourceforge.net/octave-r.html R for Matlab users
Files • http://escience.rpi.edu/data/DA • This is where the files for assignments, exercise will be placed
Exercises – getting data in • Rstudio • read in csv file (two ways to do this) - GPW3_GRUMP_SummaryInformation_2010.csv • Read in excel file (directly or by csvconvert) - 2010EPI_data.xls (2010EPI_data tab) • See if you can plot some variables • Anything in common between them?
Exercises • Scipy • In Spyder read in a matlab file: • import scipy.io as sio • mat_contents= sio.loadmat(‘Williams40.mat’) • mat_contents • Explore – plot, etc. • Read in a csv file (your choice) • Write out as matlab file, i.e. sio.savemat (see File I/O help http://docs.scipy.org/doc/scipy/reference/tutorial/io.html ) • http://docs.scipy.org/doc/scipy/reference/tutorial/stats.html - start looking
Exercises • Matlab • Read in two different datasets: • sw40_30s.mat or sw29adcp.mat • UChicago30.mat or Williams40.mat • Explore them… • Read in the csv files
If time or for fun… • se_eqs.xls • Plot it • Fit it • PRESSURE.xls • Plot it • Smooth it • Fit it …
Install-fest… continues • http://projects.apache.org/indexes/category.html#database • Hadoop(MapReduce) • Pig (http://wiki.apache.org/pig/RunPig ) • HIVE (http://hive.apache.org/releases.html ) • https://cwiki.apache.org/confluence/display/Hive/GettingStarted • https://cwiki.apache.org/confluence/display/Hive/Tutorial • https://cwiki.apache.org/confluence/display/Hive/LanguageManual • Cassandra (binaries from DataStax) • And MongoDB - http://www.mongodb.org/
Objective • Get a good feel for the complexity and maturity of the data and tools environments • See some real data and start to consider what it will take to work with it • Big and complex - means time and memory and laptops only can do so much • We’ll soon look at the intersections like RHadoop: https://github.com/RevolutionAnalytics/RHadoop/wiki
No more reading this week • Complete the installs as best you can • Pick your preferred application and data software and read up on them, try some examples