Download
1 / 25
250 likes | 339 Views
This study evaluates the predictability of zonal-mean climate change using the annular mode structure, focusing on Southern Hemisphere climate conditions. By analyzing spatial structures and statistical patterns, the research assesses the relationship between the annular mode and climate variability in a dynamic GCM model. Results suggest better predictability for changes in high-latitude cooling and tropical heating, impacting jet stream structures and atmospheric circulation. The study highlights the role of the annular mode in predicting climate change and its applications in understanding global warming effects.

E N D
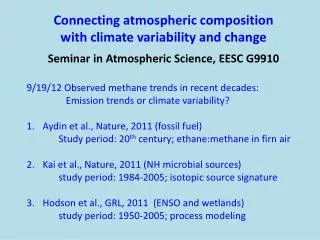
Preferred Modes of Variability and Their Relationship with Climate Change Seok-Woo Son and Sukyoung Lee The Pennsylvania State University Department of Meteorology
Annular Mode - Dominant internal variability of the atmosphere SH NH • Leading EOF of SLP [u] • Zonally symmetric • Quasi-barotropic • Useful for understanding internal variability SLP • Useful for understanding climate change (?) Thompson et al. 2000
SH [u] response to global warming NH [u] trend 1968-1997 pressure (hPa) NH Annular Mode SH Annular Mode pressure (hPa) latitude Thompson et al. 2000 Kushner et al. 2001
“Spatial pattern” of annular mode ≈ recent trend in the observed and simulated zonal-mean circulation To what extent annular mode is capable of predicting zonal-mean climate change?
Total 49 simulations by differing radiative heating in a simple GCM Structure of [u] in the statistically steady state ( [u] ) Internal variability of [u] with a help of EOF1 and EOF2 Annular mode vs. Climate change Annular mode – EOF1 of [u] (regressed against PC1 time series) Climate change – difference of [u] between any two adjacent runs Purpose and Approaches Evaluate the predictability of zonal-mean climate change by annular mode in terms of their spatial structures.
Te(C,H) = Tbase + ΔTe(C,H) C : high-latitude cooling (K/day) H : tropical heating (K/day) Numerical Model • A dynamic core of GFDL GCM (symmetric boundary cond.) • R30L10 but zonal wave number 15 • Driven by relaxing T toward Te with timescale of 30 days • Dissipated by linear friction and 8th order hyperdiffusion
(C,H)=(0.83,0.33) (C,H)=(0.17,1.67) (C,H)=(0.17,0.33) [u] Double Jet Intermediate Jet Single Jet Numerical Model (Cont.) • Total 49 realizations C (0.00, 0.17, 0.33, 0.50, 0.67, 0.88, 1.00) K/day H (0.00, 0.33, 0.67, 1.00, 1.33, 1.67, 2.00) K/day • Statistics are derived from the last 4500 days of each 5000-day integration. Data of both hemispheres are used.
[u] : Structure of Westerly Jets • Strong C & weak H → Double Jet SJ • H ≥ 1.00K/day → Single Jet WJ DJ
Internal variability of the jets [u] & EOFs One-point correlation of 250-hPa [u]' Zonal-index (Jet Meander) SJ WJ Transition Poleward Propagation DJ
Time series of PC1 and PC2 Correlation PC1 vs. PC2 Zonal-index (Jet Meander) SJ Transition WJ Poleward Propagation DJ Poleward Propagation: i. Correlation between PC1 & PC2 is very high ii. Var(EOF2) is comparable to Var(EOF1)
Collocates with intermediate- and double-jet Shading χ≥ 0.5 Shading γ≥ 0.5
Climate change : Difference of [u] between two adjacent runs • δ[u]H (0.50,1.00) = [u] (0.50,1.33) - [u] (0.50,1.00) • δ[u]C (0.50,1.00) = [u] (0.67,1.00) - [u] (0.50,1.00) [u] (0.50,1.00) δ[u]H (0.50,1.00) δ[u]C (0.50,1.00) Annular mode & Climate change in the modeI • Annular mode : EOF1 of [u] • [u] is regressed against PC1 time series, unit of m/s.
I. Global measure : pattern correlation between EOF1 and δ[u] from 150-950 hPa and 10-80˚ EOF1 & δ[u]C EOF1 & δ[u]H Predictability of Climate change by Annular mode Shading correlation ≥ 0.8 Predictability is always poor in a poleward propagation regime.
Poor predictability ofδ[u]Hin a zonal-index regime • Annular mode in the model is associated with eddy fluxes. • δ[u]Cis associated with eddy fluxes. • δ[u]H is associated with both eddy fluxes and mean-meridional circulation. • Predictability of δ[u]C would be better than that of δ[u]H. • Increase of C → enhances extratropical baroclinicity • Increase of H → enhances subtropical baroclinicity and • intensifies Hadley circulation
Structure of Westerly Jet • Strong C & weak H → Double Jet • H ≥ 1.00 K/day → Single Jet Internal Variability • Strong C & weak H → Poleward propagation • (Comparable effect of EOF2) • Weak C & strong H → Zonal index • (Dictated by EOF1) • Broad transition zone Predictability of Climate change by Annular mode • Dependent on the dominant internal variability • Relative good in a transition regime Summary
EOF1 & δ[u]H EOF1 & δ[u]C [u]: structure of the jet SH SH SH Application to the Southern Hemisphere • Applied to the SH climate change at equinoctial condition Global warming at SH → ENSO-like tropical heating & enhanced extratropical baroclinicity (Son and Lee 2005a) → increase of H and C. • Structure of the jet Wide range of interannual variability from single- to double-jet states • Internal variability Both poleward propagation and zonal index (e.g., Feldstein 1998; Hartmann and Lo 1998) with γ ≈ 0.5 and χ ≈ 0.3 (Son and Lee 2005b).
EOF1 & δ[u]H EOF1 & δ[u]C SH SH Application to the Southern Hemisphere (Cont.) • Predictability is marginally good in the SH-like parameter regime. • Annular mode may not be useful for understanding paleoclimate change. Slight climate drift to the poleward propagation regime → poor predictability.
Any comment and suggestion are welcome. Thank you! Contact information Seok-Woo Son: sus141@psu.edu
The latitudinal distance over which the value of 250-hPa quasi-geostrophic PV gradient ([q]y) is greater than 60% of its maximum value. Shading for ≥ 35˚. Dependency of internal variability to the mean flow • The meridional radiation of the waves is prohibited if the PV gradient of the ambient flow is sufficiently sharp (e.g., Hoskins and Ambrizzi 1993) • Poleward propagation of westerly anomalies may occur only when the PV gradient is relatively weak and broad.
[u] (0.50,100) δ[u]H (0.50,100) δ[u]C (0.50,100) Prediction of Climate-change ‘Direction’ by Annular mode? • Climate change direction (positive or negative phase of annular mode) is determined not by the annular mode but by the nature of external forcing. • Climate change associated with H increase (warming at tropics) →negative phase of annular mode (out of phase). • Climate change associated with C increase (broadening of extratropical baroclinic zone) →positive phase of annular mode (in phase). - +
SH [u] response to global warming Climate change in SH is in phase with SH annular mode. SH Annular Mode By the overwhelming effect of enhanced baroclinicity (C) over tropical warming (H) ? Kushner et al. 2001 Prediction of Climate-change ‘Direction’ ? (Cont.) Climate change in SH: tropical warming & enhanced extratropical baroclinicity (Son and Lee 2005a) → increase ofHandC.
II. Local measure : latitudinal distance between extrema of EOF1 and δ[u] at 250 hPa EOF1 & δ[u]C(line A) • δφC : between EOF1 and δ[u]C • δφH : between EOF1 and δ[u]H δφC A Predictability of Climate change by Annular mode • measured at both • subtropics and extratropics
δφC(mid-latitude) δφC (low-latitude) δφH (low-latitude) δφH (mid-latitude) Shading γ≥ 0.5 Shading δφ≤ 2˚ • Weak latitudinal dependency of δ[u]Cprediction by annular mode. • Poor predictability of δ[u]Hin a zonal-index regime is due to the mid-latitudes. • Predictability is generally good when γ ≤ 0.5 or Var(EOF1) ≥ 2•Var(EOF2)
II. Local measure : Compare amplitude of 250-hPa |EOF1| and |δ[u]| at 250 hPa EOF1 & δ[u]C(line A) δφC A Prediction of Climate-change ‘Amplitude’ by Annular mode?
shading:δφC ≤ 2˚ shading:δφH ≤ 2˚ ratio |δ[u]|/|EOF1| difference (|δ[u]| - |EOF1|) • Ratios of |δ[u]C| to |EOF1| are 0.3 to 0.8. Ratios vary only by a factor of two! • Ratios of |δ[u]H| to |EOF1| are 1.0 to 2.5 Predictable? No theories yet! Prediction of Climate-change ‘Amplitude’ by Annular mode?