Database
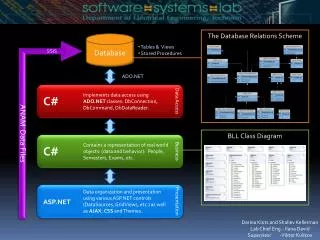
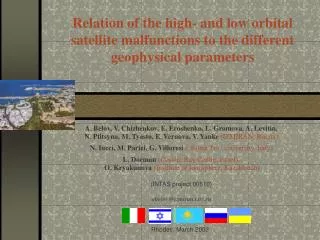
Relation of the high- and low orbital satellite malfunctions to the different geophysical parameters. A. Belov, V. Chizhenkov, E. Eroshenko, L. Gromova, A. Levitin, N . Ptitsyna, M. Tyasto, E. Vernova, V. Yanke (IZMIRAN, Russia)

Database
E N D
Presentation Transcript
Relation of the high- and low orbital satellite malfunctions to the different geophysical parameters A. Belov, V. Chizhenkov, E. Eroshenko, L. Gromova, A. Levitin, N. Ptitsyna, M. Tyasto, E. Vernova, V. Yanke(IZMIRAN, Russia) N. Iucci,M. Parizi, G. Villoresi(“Roma Tre” University, Italy) L. Dorman (Cosmic Ray Centre, Israel),O. Kryakunova (Institute of Ionosphere, Kazakhstan) (INTAS project 00810) abelov@izmiran.rssi.ru Rhodes, March 2003
Database Rhodes, March 2003
Satellite malfunction data The main contribution was from NGDC satellite anomaly database, created by J. Allen and D. Wilkinson. + “Kosmos” data (circular orbit at 800 km altitude and 74º inclination) + 1994 year anomalies - Walter Thomas report (Thomas, 1995). + The satellites characteristics - from different Internet sources: http://spacescience.nasa.gov/missions/index.htm http://www.skyrocket.de/space/index2.htm http://hea-www.harvard.edu/QEDT/jcm/space/jsr/jsr.html http://www.astronautix.com/index.htm Rhodes, March 2003
Satellite and Anomaly Number ~300 satellites~6000 satellite malfunctions Rhodes, March 2003
Groups of satellites Rhodes, March 2003
Red, GreenandBlueGroups Rhodes, March 2003
Period with big number of satellite malfunctions Upper panel – cosmic ray activity near the Earth: variations of 10 GV cosmic ray density; solar proton (> 10 MeV and >60 MeV) fluxes. Lower panel – geomagnetic activity: Kp- and Dst-indices. Vertical arrows on the upper panel correspond to the malfunction moments. Rhodes, March 2003
Other example • Upper panel – cosmic ray activity near the Earth: variations of 10 GV cosmic ray density; electron (> 2 MeV) fluxes – hourly data. • Vertical arrows correspond to the malfunction moments. Lower row – all malfunctions. • Lower panel – geomagnetic activity: Kp- and Dst-indices. Rhodes, March 2003
High- and low altitude anomalies No correlation between high and lowmalfunction’s frequencies Rhodes, March 2003
Seasonal dependence Anomaly’s frequency (all orbits)with statistical errors 27-day averaged frequencies and correspondinghalf year wave Rhodes, March 2003
Seasonal dependence Satellite malfunction frequency and Ap-index averaged over the period 1975-1994. The curve with points is the 27-day running mean values; the grey band corresponds to the 95 % confidence interval. The sinusoidal curve is a semidiurnal wave with maxima in equinoxes best fitting the frequency data. Rhodes, March 2003
Seasonal dependence (different orbits) 27-day averaged frequencies and correspondinghalf year wave for different satellite groups Rhodes, March 2003
Time distribution of anomalies Rhodes, March 2003
Space Weather Indices • Solar activity • Solar wind • Geomagnetic activity • Solar protons • Electrons • Ground Level Cosmic Rays ~30 indices in total Rhodes, March 2003
Solar activity 27-day running averaged Sunspot Numbers and Solar Radio Flux We useSSN and F10.7– daily Sunspot Numbers and radio fluxes; SSN27, SSN365– 1 year and 1 rotation running averaged SSN Rhodes, March 2003
Geomagnetic activity Daily Ap-index and minimal (for this day) Dst-index We useApd, Apmax– daily and maximal Ap-index; AEd, AEmax – daily and maximal AE-index; DSTd, DSTmin – daily and minimal Dst-index; Rhodes, March 2003
Protons and electrons Daily proton and electron fluencies We usep10, p100 – daily proton (>10, >100 MeV) fluencies (GOES); p10d, p60d – daily proton (>10, >60 MeV) fluxes (IMP); p10max, p60max – maximal hourly proton (>10, >60 MeV) fluxes (IMP); e2 – daily electron (>2 MeV) fluence (GOES); e2d, e2max – daily and maximal electron (>2 MeV) fluх (GOES); Rhodes, March 2003
Solar Wind Daily solar wind speed and intensity of interplanetary magnetic field We useVsw, Vmax– daily and maximal solar wind speed; Bm – daily IMF intensity; Bzd, Bzmin– daily and minimal z-component IMF (GSM); Bznsum– sum of negative z-component values; Rhodes, March 2003
Cosmic Ray Activity Indices + Daily CRA-indices and sum of negative IMF z-component We useda10, CRA– indices of cosmic ray activity, obtained from ground level CR observations (Belov et al., 1999); Eakd, Eakmax – estimation of daily and maximal energy, transferred from solar wind to magnetosphere (Akasofu, 1987); Rhodes, March 2003
SSCs and anomalies • Averaged behavior of satellite malfunction frequency near Sudden Storm Commencements • 634 days with SSC in total • a – all storms • b – storms with Ap>50 nT • c – storms with Ap>80 nT Rhodes, March 2003
SSCs and anomalies • Averaged behavior Ap, Dst – indices of geomagnetic activity and satellite malfunction frequency near Sudden Storm Commencements • Malfunctions start later and last longer than magnetic storms Rhodes, March 2003
Proton events and anomalies • Averaged behavior of p>10, p>100 MeV and satellite malfunction frequency during proton event periods. • The enhancement with >300 pfu were used Rhodes, March 2003
Proton events and anomalies Mean satellite anomaly frequencies in 0- and 1-days of proton enhancementsin dependence on the maximal > 10 MeV flux Rhodes, March 2003
Proton events and anomalies Probability of any anomaly (highaltitude – highinclination group) in dependence on the maximal proton > 10 and >60 MeV flux Rhodes, March 2003
Proton events and anomalies 0-day = day of anomaly Rhodes, March 2003
Electrons and anomalies 0-day = day of anomaly Rhodes, March 2003
Proton and electron hazardson the different orbits Mean proton and electron fluencies on the anomaly day Rhodes, March 2003
Anomalies and different indices(precursors) Mean behavior of Ap-index in anomaly periods (GEO satellites) Rhodes, March 2003
Anomalies and different indices(precursors) Mean behavior of >2 MeV electron fluence in anomaly periods (GEO satellites) Rhodes, March 2003
Anomalies and different indices(precursors) Mean behavior of solar wind speed in anomaly periods (GEO satellites) Rhodes, March 2003
Models of the anomaly frequency • We checked ~ 30 different Space Weather parameters and a lot of their combinations • We used the parameters for anomaly day and for several preceding days • Only simplest linear regression models were checked (exclusions for e and p indices) • Obtained models contain 3-8 different geo- heliophysical parameters • The models appear to be different for different satellite groups Example of frequency model (GEO): Rhodes, March 2003
Models of the anomaly frequency low alt.-high incl. cc=0.2 • e>2 MeV • CRA • Apd, AEd, sf • Vsw, Bzd high alt.- low incl. cc=0.39 • e>2 MeV • Apd, AEd, sf • p60d, p100 Vsw • Bzd, da10 high alt.-high incl.cc=0.7 • p>100 MeV, p60d • Eak, Bznsum, SSN365 Rhodes, March 2003
Summary • The relation between Space Weather parameters and frequency of satellite malfunctions are different for different satellite groups (orbits) • The models simulated anomaly frequency in different orbits are developed and could be adjusted for forecasting Rhodes, March 2003
The End Rhodes, March 2003