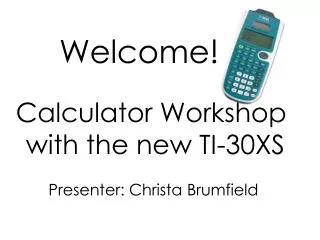
Calculator Workshop
Learning Center. Calculator Workshop. Welcome. Jan 2011 Breanna Gonzales, Master Tutor. Calculator Objective. How to graph How to pull up the table How to adjust the screen (2 ways) How to convert decimal to fractions and back How to store answers

Calculator Workshop
E N D
Presentation Transcript
Learning Center Calculator Workshop Welcome Jan 2011 Breanna Gonzales, Master Tutor
Calculator Objective • How to graph • How to pull up the table • How to adjust the screen (2 ways) • How to convert decimal to fractions and back • How to store answers • How to check to see if a solutions is right
Graphing y= 4x+4 1st Press the [Y=] Button This screen should pop up 2nd Type in 4x+4 in the screen to look like the screen does Hint to type in X you can press the [x,T,θ,n] Button Or Press [ALPHA] then the button below the the X letter
Graphing y= 4x+4 3rd Press the [GRAPH] button This screen should pop up And plot your graph 4th Press the [2nd] button Then [GRAPH](TABLE) to get your table for the Graph This screen should pop up And you should be able to see your Table values
Adjusting the Screen To Adjust the screen Manually Press the [WINDOW] button This screen should pop up • What everything means • Xmin= is the minimum x value you will see on the x-axis • Xmax=is the maximum x value you will see on the x-axis • Xscl= is the increment you will see the graph on • Ymin=, Ymax=, and Yscl= are the same as the above except they are for the y-axis
Adjusting the Screen • How to use everything in an example • Xmin= put in -1 • Xmax=put11 • Shown on screen • Ymin= put in -1 • Ymax= put in 11 Now press the [GRAPH] button again your altered graph and screen should appear
Adjusting the Screen The second way to alter your screen is to use the [ZOOM] button Press the [ZOOM] button This Screen Should Pop up • How to use each selection • Zoom in: press enter to zoom in • Zoom Out: press enter to zoom out • Z Standard: press and Ymin=, Ymax=, Xmin=, Xmax will go back to regular setting • Z Trig: will give you widow helpful for trig functions • ZoomFit: will try to fit the graph on the screen
Decimals to Fractions Lets Practice with the decimal 0.5 and convert it to ½ and back to 0.5 1st type in 0.5 2nd press the [MATH] button This screen should pop up 3rd press [1] button or highlight the 1 on the screen an push [ENTER] button This screen should pop up on your screen 4th Press the [Enter] button and now your answer should be ½
Fractions to Decimals You already have ½ fraction from the previous example so we are going to change it back 1st press the [MATH] button This screen should pop up 2nd press [2] button or highlight the 2 on the screen an push [ENTER] button 3rd Press the [Enter] button and now your answer should be .5
Storing Answers Storing Answers in the calculator can be helpful in a couple of ways. So here is an example of how to store and answer and how to use it later. 1st type in 2+2 then the [ENTER] button to get 4 2nd press the [STO→] button 3rd press the [ALPHA] button then a letter above the buttons that you want to store the 4 as we are going to use A 4th press the [Enter] button and now 4 is stored as A
Storing Answers Now we want to recall the answer 4 and divide it by 2 .In the end it will be 4 ÷ 2=2 1st you press [ALPHA] then the letter you stored 4 as which is in this example was A 2nd press [÷] button and then 2 then enter to get your answer of 2
Checking Solutions To check solutions you will be using by storing an answer and typing in the equation. The example we are going to use is 12=4x+2. To get a TRUE STATEMENT out of this X will be have to equal to 2. 1st we need to store 2 as X by pressing [2] then [STO→] 2nd [X,T,θ,n] or [ALPHA] then the button below the x letter 3rd press [ENTER]
Checking Solutions To check solutions for the example12=4x+2. To get a TRUE STATEMENT out of this equation X will be have to equal to 2. • 4th now you need to type in 4x+2 • Press the [4] button • Press the [X,T,θ,n] • Press the[+] • Press the [2] 5th press [ENTER] to get the answer of 2
This is it for now You Did it!!! Thank You I hope this Power Point helped you With your TI Graphing Calculator Keep up the good Work! And remember if you still would like some more help with your Math or Calculator the tutors in the LRC Are ready to help