Download
1 / 13
130 likes | 161 Views
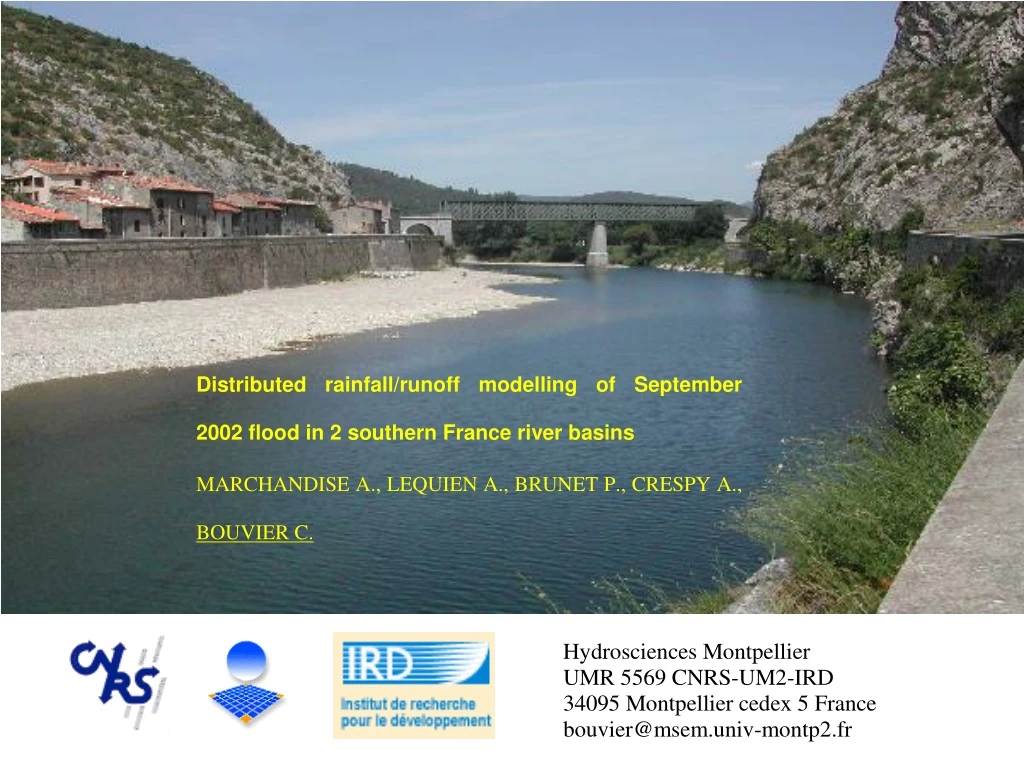
Investigating rainfall-runoff modeling for floods ranging from normal to extreme in two southern France catchments. Analyzing catchment parameters, model efficacy, and post-flood field survey results to improve efficiency and gather extreme flood data.

E N D
Questions concerning rainfall-runoff modelling 1. Which model, from normal floods to extreme floods ? 2. How do parameters vary from a catchment to another ? 3. Why does the model work ?
Vaison, 1992 Last floods in South of France Aude, 1999; Gard, 2002 Nîmes, 1988
8 September 2002 flood Isohyets area (24h) : 200 mm 4000 km² 300 mm 3100 km² 400 mm 1800 km² 500 mm 720 km² 600 mm 150 km²
Study area Gardon catchment (525 km2)metamorphic clay and granitesteep slope, mountainous area 3 sub-catchments 6 sub-catchments Vidourle catchment (660 km2)marl and limestone smooth slope, plain area
Post-event analysis : peak flood estimates from field survey
Localisation et résultats des relevés de terrain en amont d’Anduze 102 km2, 5 m3/s/km2 88 km2, 3 m3/s/km2 67 km2, 9 m3/s/km2 12 km2, 20 m3/s/km2 31 km2, 13 m3/s/km2 21 km2, 20 m3/s/km2 12 km2, 11 m3/s/km2 8 km2, 20 m3/s/km2 4,6 km2, 30 m3/s/km2 67 km2, 9 m3/s/km2 1,7 km2, 21 m3/s/km2 3,2 km2, 37 m3/s/km2 13 points de mesures + 3 stations DDE 3 km2, 27 m3/s/km2
How does the model work? Radar or interpolated rainfall at 60 mn V = Vo.p0.5.S0.2 SCS on elementary cell water retention in soilS
Normal to extreme floods 11 floods from 200 up to 3000 m3/s S = 250 mm V = 12.p0.5.S0.2
S=160 mm S=150 mm 1 4 S=200 mm S=160 mm 6 2 S=170 mm S=200 mm 3 S ~150-200 mmsoil water retention 5 Regional analisis of the 8-9 september event on Vidourle catchment
Regional analisis 8-9 sept 2002 Gardon Anduze 2 S = 250 mm 1 2 3 3 1 S = 250 mm S ~200-250 mmsoil water retention S = 200 mm
Conclusions Improve rainfall-runoff models efficiency get extreme data ! control normal to extreme study regional variability relationship with physical characteristics Good results in two southern France catchments with a distributed SCS model ~200 mm soil water retention