Download
1 / 28
280 likes | 296 Views
This report highlights the developments and current trends in state solar policies in the years 2007-2008, including federal updates, state highlights, and other state developments. It also provides information on state financial incentives, tax credits, regulatory policies, and public benefit funds for solar.

E N D
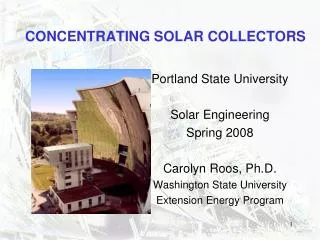
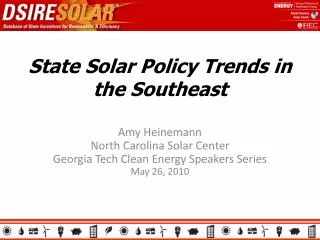
State Solar Policy:2007-08 Developments & Current Trends Rusty Haynes N.C. Solar Center N.C. State University IREC Annual Meeting October 13, 2008
The DSIRE Project www.dsireusa.org Database of State Incentives for Renewables & Efficiency • Created in 1995 • Funded by U.S. DOE • Managed by NCSU; affiliated with IREC • Project Scope: policies/programs that promote RE/EE • Breakdown of Data: ~1,850 total records~790 solar records~715 PV records
Federal Update • Extended to 12/31/2016 • May be used to offset AMT • Extended to utilities Solar ITC Residential Solar Credit • Extended to 12/31/2016 • $2,000 cap removed for PV (1/1/2009) • May be used to offset AMT
State Highlights, 2007-08 • RPS raised from 9.5% to 20% x 2022 (Tier I) • Solar access law strengthened • PV property tax exemption extended to non-rez PV • S&U tax exemption for solar • New IC standards • Commonwealth Solar ($68M / 27 MW) • Three separate energy standards (Class I: 4% x 2009 + 1%/year) • New grants and loan programs (TBD) • Net metering raised to 1 MW / 2 MW • Long-term utility solar purchases Maryland Massachusetts
State Highlights, 2007-08 • RPS: 12.5% RE, 12.5% “advanced” energy x 2024 • Solar carve-out: 0.5% • $650M fund for RE/EE • $100M in incentives for homes & small biz • $80M in incentives for solar economic dev • $165M in incentives for non-solar RE & AE (biz, local gvt) • $50M in tax credits for RE/EE/AE projects • Stronger net metering (NEG) Ohio Pennsylvania
Other State Developments, 2007-08 • Rebates(new): CO (local), CT (PV), MA (PV), MN (SWH) • Rebates(revised): several states adjusted amounts and/or added small wind • Tax credits (new/improved): GA (35%), KY (small), OR (limit doubled), PA (15%), VT (30%) • Property tax incentives: AZ, FL, MD, NC, NY • RPS/RPG: MA, MD, OH, / GU, SD, UT • Net Metering(improved): CO, DC, FL, HI, IL, KY, LA, MA, NY, OH, PA, RI, UT, VT • Interconnection Standards(new/improved): CT, FL, IL, MD, MI, NC, NM • Solar access(improved): CA, CO, FL, MD, VA
www.dsireusa.org September 2008 State Financial Incentives for Solar
State Rebates & PBIs for PV www.dsireusa.org September 2008 ME: $2K max 15 - 54¢/kWh • 20 state rebate programs & PBIs* • 25 state grant programs(not shown on map) • 21 non-state PBIs (not shown on map) • 64 utility rebate programs(not shown on map) VT: $1.75-3.50/W $2-2.25/W NY: $3-5/W MA: $2-5.50/W $1-2.25/W ≤35% CT: $4.30-5/W $3k max NJ: SRECs $2.30-4.60/W 30% DE: 50% ≤$4.50/W MD: $2.50/W ≤$3.25/W ≤50¢/kWh, 5 yrs. 40% $2-3/W $4/W * Includes RPS-inspired utility rebate programs in AZ, CO & NV
Direct Incentives for PV, 1997 www.dsireusa.org 10-20% up to $75K 50% up to $10K Varies by project $2K - $10K $10K - $50K $60K - $1M
www.dsireusa.org September 2008 State Tax Credits for PV VT: 30% (C) 35% 15% $3/W (R) 50% (C) 25% (R) MA: 15% (R) 100% Deduct. (R) RI: 25% 25% (R) 10% (C) $500 (R) $1K (C) • Credits in 17 states • Range: 10% - 50% • FL, IA, MD, NE, OK have small PTCs (not shown on map) 35% 25% (R) 30% (Non-Corp.) ~2.7¢/kWh 10 yrs. (C) 10% (NR) 25% 35% 50% 35% (R) Residential; (C) Commercial; (NR) Non-Residential
State Regulatory Policies • Public Benefits Funds (16+DC & ME) • Renewables Standards/Goals (26+DC & 6 goals) • Net Metering (39) • Solar Access Laws (35) • Green Power Purchasing Policies (10) • Contractor Licensing (9)
Public Benefit Funds for Renewables www.dsireusa.org March 2008 MT: $750,000 in 2008 $8.3M from 1999-2009 ME: voluntary contributions $411,000 from 2002-2008 VT: $6.6M in 2008 $34M from 2004-2011 MN: $16M in 2008 $264M from 1999-2017* MA: $25M in 2008 $525M from 1998-2017* MI: $1.7M in 2008 $25M from 2001-2017* OR: $12M in 2008 $182M from 2001-2017** RI: $2.2M in 2008 $38M from 1997-2017* WI: $5.5M in 2008 $97M from 2001-2017* CT: $24M in 2008 $435M from 2000-2017* IL: $5.5M in 2008 $99M from 1998-2015 OH: $3.2M in 2008 $63M from 2001-2010 NY: $9.5M in 2008 $114M from 1999-2011 CA: $331M in 2008 $4,149M from 1998-2016 NJ: $102M in 2008 $637M from 2001-2012 PA: $950,000 in 2008 $63M from 1999-2010 DE: $3.5M in 2008 $49M from 1999-2017* D.C.: $400,000 in 2008 $5.1M from 2004-2017* * Denotes funds that do not have defined expiration dates and do not require future reauthorization or budgetary approval in order to continue operations. (These funds are not scheduled to expire in 2017.) 16 state funds + DC $6.8B by 2017 (est.) ** The Oregon Energy Trust is scheduled to expire in 2025.
DSIRE: www.dsireusa.org September 2008 Renewables PortfolioStandards ME: 30% by 2000 10% by 2017 - new RE MN: 25% by 2025 (Xcel: 30% by 2020) VT: (1) RE meets any increase in retail sales by 2012; (2) 20% by 2017 *WA: 15% by 2020 • NH: 23.8% in 2025 ND: 10% by 2015 WI: requirement varies by utility; 10% by 2015 goal MA: 15% by 2020 + 1% annual increase(Class I Renewables) MT: 15% by 2015 OR: 25% by 2025(large utilities) 5% - 10% by 2025 (smaller utilities) RI: 16% by 2020 SD: 10% by 2015 CT: 23% by 2020 • *NV: 20% by 2015 • OH: 25%** by 2025 *UT: 20% by 2025 IA: 105 MW • NY: 24% by 2013 IL: 25% by 2025 • NJ: 22.5% by 2021 • CO: 20% by 2020(IOUs) *10% by 2020 (co-ops & large munis) CA: 20% by 2010 • PA: 18%** by 2020 MO: 11% by 2020 • MD: 20% by 2022 • NC: 12.5% by 2021(IOUs) 10% by 2018 (co-ops & munis) • AZ: 15% by 2025 • *DE: 20% by 2019 • DC: 11% by 2022 • NM: 20% by 2020(IOUs) • 10% by 2020 (co-ops) *VA: 12% by 2022 TX: 5,880 MW by 2015 HI: 20% by 2020 State RPS State Goal • Minimum solar or customer-sited RE requirement * Increased credit for solar or customer-sited RE • **Includes separate tier of non-renewable “alternative” energy resources Solar water heating eligible
www.dsireusa.org Renewables PortfolioStandards, 1997 ME: 30% by 2000 MN: 425 MW by 2002 MA (under development) NV: 1% by 2009 IA: 105 MW by 1999 AZ: 1.1% by 2007
www.dsireusa.org September 2008 Solar/DG Provisions in RPS Policies (~7,550 MW by 2025) WA: double credit for DG NH: 0.3% solar electric by 2014 MA: TBD by MA DOER NV: 1% solar by 2015; 2.4 to 2.45 multiplier for PV NY: 0.1542% customer-sited by 2013 NJ: 2.12% solar electric by 2021 OH: 0.5% solar electric by 2025 PA: 0.5% solar PV by 2020 CO: 0.8% solar electric by 2020 DE: 2.005% solar PV by 2019; Triple credit for PV MD: 2% solar electric in 2022 AZ: 4.5% DG by 2025 DC: 0.386% solar electric by 2022 NM: 4% solar electric by 2020 0.6% DG by 2015 NC: 0.2% solar by 2018 Solar water heating counts towards solar set-aside Note: “DG” means distributed generation
Largest RPS Markets for Solar in Near-Term: NJ, AZ, NM, NV, NC, CO Source: LBNL Environmental Energy Technologies Division / Energy Analysis Department
Most Aggressive RPSs, Required Solar as % of Sales California goal of 3,000 MW equals ~ 1.5% Source: LBNL Environmental Energy Technologies Division / Energy Analysis Department
Interconnection Standards • Technical issues include safety, power • quality, system impacts. Technical • issues largely resolved. • Policy issues include legal and • procedural considerations. State • approaches vary widely. • Best policies adopted by IL, NJ, PA, NM, MD.* IREC model: www.irecusa.org/index.php?id=87 * Freeing the Grid 2008: www.newenergychoices.org
Net Metering • Allows customers to store any excess electricity generated, usually in the form of a kWh credit, on the grid for later use. • Available “statewide” in 39 states. State policies vary dramatically. • Best policies adopted by CO, MD, FL, NJ, OR.* IREC model: www.irecusa.org/index.php?id=88 * Freeing the Grid 2008: www.newenergychoices.org
Net Metering DSIRE: www.dsireusa.org September 2008 100 VT: 250 NH: 100 MA: 60/1,000/2,000* RI: 1,650/2,250/3,500* CT: 2,000* 100 * * 50 100 * 25/2,000 40 20 * 25/100 * 30 * NY: 25/500/2,000* PA: 50/3,000/5,000* NJ: 2,000* DE: 25/500/2,000* MD: 2,000 DC: 100 VA: 10/500*NC: 20/100* 25 * no limit 500 25 * 1,000 * * 2,000 40 25 10 * * 25/2,000 1,000 co-ops, munis: 10/25 100 30 * * varies 80,000 100 25/300 20/100 * 10/100 * 50 25/300 FL: 2,000* 100 (KIUC: 50) Net metering available in 44 states + D.C. State-wide net metering for all utility types * State-wide net metering for certain utility types only (e.g., investor-owned utilities) Net metering offered voluntarily by one or more individual utilities (Note: Numbers indicate individual system size limit in kilowatts (kW). Some states’ limits vary by customer type, technology and/or system application. For complete details, see www.dsireusa.org.)
Solar Access Laws • 14 states limit or prohibit restrictions that neighborhood covenants and/or local ordinances may impose on the use of solar-energy systems. (Solar easements allow for the rights to existing solar access on the part of one property owner to be secured from another property owner whose property could be developed in such a way as to restrict the solar resource. Transferred with property title. Most states allow these.)
In Conclusion… State trends: Dominance of RPS Super-sized net metering Regional solar markets Shift toward PBIs PPA model Room for Improvement: Incentives for non-taxpayers Utility rate structures REC-selling opportunities Market coordination Federal policy Wild cards: Credit markets? State budgets? Electricity rates? Technology breakthroughs?
Solar-Specific Incentive Information Clickable U.S. Map for Quick Access to PV Incentives PV Incentive Summary Maps State-by-State Incentive Comparison Tables Tax Credits, Rebates, Solar Portfolio Standards, Net Metering PV Incentive Program Installation Data from IREC # of Installations, Incentive $ Expenditures, Capacity Installed Solar Policy Guide S lar P rtal Coming soon
DSIRE Unique Visitors, 2005-08 Feb. 2005 Aug. 2005 Feb. 2006 Aug. 2006 Feb. 2007 Aug. 2007 Feb. 2008 Aug. 2008
Contact: Rusty Haynes N.C. Solar Center N.C. State University rusty_haynes@ncsu.edu www.dsireusa.org919.513.0445