Quick Guide
120 likes | 133 Views
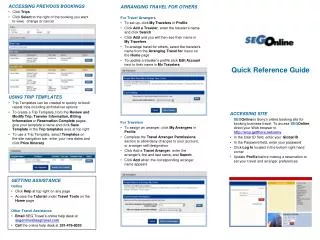
Compare trends in global economies, insurance markets, and Lloyd's through a comprehensive analysis of countries. Access data on macroeconomic indicators, insurance market premium, reinsurance, and Lloyd's market. Analyze specific Lloyd's classes and their growth patterns. Available for Managing Agents, Strategy & MI teams.

Quick Guide
E N D
Presentation Transcript
Quick Guide Compare Countries 30/09/2019 Esc Esc to stop at any time CLICK to start guide Insights Hub guidance
CLICK TO CONTINUE BACK TOCONTENT Content What & Where? Dashboard structure Discovery journeys Analyse a country Analyse a Lloyd’s class Insights Hub guidance
CLICK TO CONTINUE BACK TOCONTENT 1 2 3 4 5 6 7 ANIMATION STEPS: 7 DATA ACCESSIBILITY Data available via a password-protected download from Market Intelligence LLOYD’S DATA GRANULARITY Lloyd’s Aggregate data only DATA AUDIENCE For Managing Agents, Strategy & MI teams COMPARE COUNTRIES Compare trends in global economies, insurance markets and Lloyd’s GLOBAL STATISTICS provides global annual statistics by country DATA DISCOVERY interactive Qlik Sense dashboard 3 LENSES OF ANALYSIS deploys 3 lenses for country analysis 1 Gross Domestic Product, inflation, current account, government gross debt, economic freedom index, governance and doing business indicators MACROECONOMICINDICATORS WHAT Motor, Property, A&H, General Liability, Pecuniary Loss, Transport, Aviation; top-10 insurance companies & total reinsurance premium LOCAL (RE)INSURANCE MARKET PREMIUM 2 LATINO INSURANCE • Lloyd’s 10 and 60 Class of Business, Insurance / Reinsurance, Method of Placement in Gross Signed Premiums; processed premiums gross of acquisition costs and reinsurance LLOYD’S PREMIUM BY INSURED DOMICILE 3 Available to Lloyd’s Managing Agents via the Lloyd’s Insights Hub WHERE INSIGHTS HUB
CLICK TO CONTINUE BACK TOCONTENT 1 2 3 4 5 6 ANIMATION STEPS: 6 Dashboard structure Summaryshowing global view of economy, non-life market and Lloyd’s premium Macrokey macroeconomic indicators including ease of doing business and economic freedom indices Insurancenon-life insurance premium and loss ratio by country and class, as well as top insurers by country Reinsuranceceded reinsurance premium by country Lloyd’sLloyd’s Gross Signed Premiums by Lloyd’s 10 and 60 class AboutDetailed summary including definitions and sources
CLICK TO CONTINUE BACK TOCONTENT Sample data discovery journeys Analyse a countryComparing size of non-life insurance market of Brazil with Lloyd’s premium Analyse a Lloyd’s classWhat is the development of cargo business for Lloyd’s with Irish policyholders?
CLICK TO CONTINUE BACK TOCONTENT 1 2 3 4 5 ANIMATION STEPS: 5 Analyse a country Comparing size of non-life insurance market of Brazil with Lloyd’s premium OPEN dashboard MACRO ENVIRONMENT INSURANCE MARKET LLOYD’S MARKET • The Compare Countries dashboard opens on the summary page which provides a global view of: • The Macroeconomic Environment; • the non-life Market; and • the Lloyd’s Market.
CLICK TO CONTINUE BACK TOCONTENT 1 2 3 ANIMATION STEPS: 3 Analyse a country Comparing size of non-life insurance market of Brazil with Lloyd’s premium SELECT country The Compare Countries dashboard enables you to quickly select a specific country in 2 ways by: • CLICK ON MAP TO SELECT • Click country in drop down menuto select • Click country on map to select
CLICK TO CONTINUE BACK TOCONTENT 1 2 3 4 ANIMATION STEPS: 4 Analyse a Lloyd’s class View growth patterns of Lloyd’s cargo business with Irish policyholders OPEN dashboard SELECT Lloyd’s Market The Compare Countries dashboard opens on the summary page which provides a global view. The top bar shows the 6 sections of the dashboard: Summary, Macro, Insurance, Reinsurance, Lloyd’s Market & About. SELECT Lloyd’s Market
CLICK TO CONTINUE BACK TOCONTENT 1 2 3 4 ANIMATION STEPS: 4 Analyse a Lloyd’s class View growth patterns of Lloyd’s cargo business with Irish policyholders SELECT Country SELECT After selecting the Lloyd’s Market section of the Compare Countries dashboard, you will view the aggregate Lloyd’s Gross Signed Premiums. SELECT Country
CLICK TO CONTINUE BACK TOCONTENT 1 2 3 4 ANIMATION STEPS: 4 Analyse a Lloyd’s class View growth patterns of Lloyd’s cargo business with Irish policyholders CHANGE to Lloyd’s 60 After selecting “Ireland”you will view the aggregate Lloyd’s Gross Signed Premiums for Irish policyholders by Lloyd’s 10 classes. The Lloyd’s 60 classes provide further granularity including “cargo” as a class. SELECT Lloyd’s 60
CLICK TO CONTINUE BACK TOCONTENT 1 2 3 4 ANIMATION STEPS: 4 Analyse a Lloyd’s class View growth patterns of Lloyd’s cargo business with Irish policyholders SELECTcargo Once Lloyd’s 60 classes are selected, this view allow you to filter on a specific detailed class such as “cargo” to easily see the trend for Irish cargo business over the past few years for Lloyd’s. SELECT “cargo”
BACK TOCONTENT 1 2 3 4 ANIMATION STEPS: 4 Analyse a Lloyd’s class View growth patterns of Lloyd’s cargo business with Irish policyholders SELECTcargo This view now shows you cargo premium trends for Lloyd’s with Irish policyholders over the past 6 years. CHANGE any selected filters quickly