Download
1 / 40
400 likes | 495 Views
Explore the development and understanding of canopy scattering mechanisms in complex scenes with the help of structure links and sensor simulations. Collaborate on dynamic plant models for wheat and tree growth, utilizing forward and inverse ray tracers for accurate simulations.

E N D
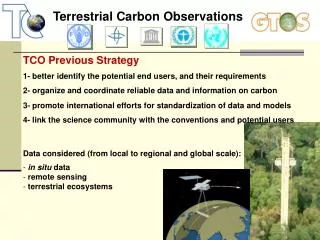
Monte Carlo Ray Tracingfor understanding Canopy ScatteringP. Lewis1,2, M. Disney1,2, J. Hillier1, J. Watt1, P. Saich1,2 • University College London • NERC Centre for Terrestrial Carbon Dynamics
Motivation: 4D plant modelling and numerical scattering simulation • Model development • Develop understanding of canopy scattering mechanisms • in arbitrarily complex scenes • Develop and test simpler models • Inversion constraint • Expected development of ‘structure’ over time • Synergy • Structure links optical and microwave • Sensor simulation • Simulate new sensors
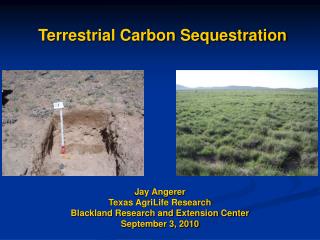
Wheat Dynamic Model Developed by INRA • ADEL-wheat • Winter wheat (cv Soisson) • Developed by: • monitoring development and organ extension at two densities • Characterising plant 3D geometry • Driven by thermal time since planting
Also Tree dynamic model • TreeGrow (R. Leersnijder) Wheat Model Development:collaboration with B. Andrieu and C. Fournier • 2004 Experiments • Test parameterisation • Develop senescence function • Varietal study • 2005 Experiments • Radiometric validation
Simulation Tools: drat: Monte Carlo Ray Tracer • Inverse ray tracer • previously called ararat • Advanced RAdiometric Ray Tracer • Requires specification of location of primitives • Multiple object instances from cloning • Shoot cloning on trees • Includes ‘volumetric’ primatives • Turbid medium
DRAT Diffuse path
DRAT Direct path
Outputs • Spectral BRF/Radiance • Image from viewer • Reflectance as a function of scattering order • Direct/diffuse components • First-Order Sunlit/Shaded per material’ • Distance-resolved (LiDAR)
An alternative: Forward Ray Tracing • E.g. Raytran • Can have same output information • Trace photon trajectories from illumination • to all output directions • Much slower to simulate BRDF • In fact, requires finite angular bin for simulations • Likely same speed for simulation at all view angles
Turbid medium RAMI: Pinty et al. 2004 http://www.enamors.org/RAMI/Phase_2/phase_2.htm
RAMI: Pinty et al. 2004 http://www.enamors.org/RAMI/Phase_2/phase_2.htm
RAMI: Pinty et al. 2004 http://www.enamors.org/RAMI/Phase_2/phase_2.htm
RAMI: Pinty et al. 2004 http://www.enamors.org/RAMI/Phase_2/phase_2.htm
RAMI model intercomparison • Extremely useful to community • Test of implementation • Comparison of models • Similar results for homogeneous canopies • Some significant variations between models • Even between numerical models for heterogeneous scenes • Partly due to specificity of geometric representations • E.g. high spatial resolution simulations • RAMI 3 preparations under way • Led by Pinty et al.
How can we use numerical model solution to ‘understand’ signal? Decouple ‘structural’ effects from material ‘spectral’ properties LAI 1.4 and 6.4 canopy cover 51% and 97% solar zenith angle 35o view zenith angle 0o A) 1500 odays B) 2000 odays
Lumped parameter modelling • Assume: • Scattering from leaves with s.s. albedo w • soil with Lambertian reflectance rs • Examine ‘black soil’ scattering for non-absortive canopy • w = 1 • rs = 0
Scattering ‘well-behaved’ for O(2+) Slope of Direct ~= diffuse for O(2+) Lewis & Disney, 1998
B.S. solution • Similar to Knyazikhin et al., (1998) • Can model as: • Where: • N.B. a is ‘p’ term in Knyazikhin et al. (1998) etc. and Smolander & Stenberg (2005) ‘recollision probability’
cover 1-exp(-LAI/2)
Canopy A Canopy B
Can assume To make calculation of direct+diffuse simpler Diffuse Direct
diffuse diffuse direct direct But a1, a2 differ for direct/diffuse (obviously)
Rest of signal ‘S’ solution Canopy A Canopy B
S. solution • Simulate w = 1 rs = 1 and subtract B.S. solution and 1st O soil-only interaction (b1) Or more accurate if include wrs2 term as well
Canopy A Canopy B
Summary • Can simulate for w = 1 rs = 0 • BS solution • And for w = 1 rs = 1 • S solution • Simple parametric model: • Or include higher order soil interactions • Use 3D dynamic model to study lumped parameter terms • And to facilitate inversion for arbitrary w , rs
Inversion • Using lumped parameterisation of CR: • ADEL-wheat simulations at 100oday intervals • Structure as a fn. of thermal time • Optical simulations • LUT of lumped parameter terms • Data: • 3 airborne EO datasets over Vine Farm, Cambridgeshire, UK (2002) • ASIA (11 channels) + ESAR sensor • Other unknowns • PROSPECT-REDUX for leaf • Price soil spectral PCs • LUT inversion • Solve for equivalent thermal time and leaf/soil parameters • Constrained by thermal time interval of observations • +/- tolerance (100odays)
Able to simulate mean field reflectance scattering using drat/CASM/ADEL-wheat • Reasonable match against expected thermal time • Processing comparisons with generalised field measures now • Similar inversion results for optical and microwave • so can use either
Summary • 4D models provide structural expectation • Can use for optical and/or microwave • Compare solutions via model intercomparison • RAMI • Can simulate canopy reflectance via simple parametric model • Thence inversion
Microwave modelling • Existing coherent scattering model (CASM) • add single scattering amplitudes with appropriate phase terms • then ‘square’ to determine backscattering coefficient • Attenuation based requires approximations
Microwave modelling • Need to treat carefully: • 3-d extinction • esp for discontinuous forest canopies • leaf curvature • esp for cereal crops
ERS-2 comparisonUsing ADEL-wheat/CASM Two roughness values (s = 0.003 and 0.005) Note sensitivity to soil in early season but later in the season the gross features of the temporal profile are similar