Download

1 / 17
180 likes | 207 Views
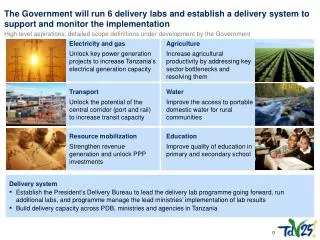
Explore data on electricity generation, distribution, gas consumption, and water usage for various sectors in June 2008. The index covers residential, commercial, mining, agricultural, industrial, and other basic consumption categories.

E N D
Electricity, Gas and Water Indexes June 2008
Electricity Statistics • A survey on generation and distribution of electricity is carried out since 1990 by INE. Electricity Generation Distribution Hydraulic Combined Cycle Other Thermal Residential Commercial Mininig Agriculture Industrial Other
Basic Consumptions • Until 2006 INE published monthly data in physical units on Electricity Production and Distribution. Statistics on Gas and Water Consumption were partially available from other sources. • A project of monthly indicators for this sector was developed considering the preparation of the Index of Basic Consumptions covering Electricity, Gas and Water as it first phase.
The second phase, to be ready during 2008 is to construct an Index of Electricity Production. • The methodology has been prepared and its development is under way.
INDEX OF CONSUMPTION OF ELECTRICITY, GAS AND WATER • The purpose of implementing this new short term indicator, is the measuring of changes in consumption of Electricity, Gas and Water by sector and region and for the country. • The base period is the average of year 2003, and the source of data are the administrative records of the enterprises belonging to these activities.
INDICATOR OF BASIC CONSUMPTIONSCOUNTRY TOTAL Index of Consumption Electricity, Gas and Water Consumption of Electricity Consumption of pipe Gas Potable Water Consumption R C M A O R I C O R O I R = Residential C = Commercial M = Mining A = Agriculture I = Industrial O = Other
INDICATOR OF BASIC CONSUMPTIONSCOUNTRY TOTAL Index of Consumption Electricity, Gas and Water, COUNTRY TOTAL I II III IV VI VII VIII IX X XI XII XIII XIV XV V Index of Consumption Electricity, Gas and Water, BY REGION Consumption of Electricity Consumption of pipe Gas Potable Water Consumption R C M A O R I C O R O I
Target population • The target population of the Index of Electricity, Gas and Water (IEGW) Consumption are all the establishments engage in some of these activities in the country (CENSUS) 51 Distributing companies Electricity 40 Distributing Water companies Water 7 Distributing Gascompanies Gas ∑ 98 Enterprises
Information sources Electricity Survey to establishments carried out by INE Administrative records of Superintendencia de Servicios Sanitarios Water Administrative records of Superintendencia de Electricidad y Combustible Gas
Weight Calculation In order to determine the relative weights a price average of year 2003, for each one of the basic breakdown of the indicator on each level is applied to annual consumption in physical units. The value of each level compared to the total is the relative weight of the level. Electricity Consumption The information on price of distribution of electricity by region was obtained from administrative records of the National Energy Commission. An average price for distributor was calculated
Gas Consumption • The information on average price of the cubic meter of natural gas and City gas by region was provided by the Electricity and Combustible Controller Office (Reference prices). Consumo de Agua Potable • The source of the average price of distribution of water information is the Superintendent of Sanitation Services, which provide peak (November through April) and no peak values (May through October) of cubic meter of consumption and sewage, plus the fixed charge per costumer. This information is given by company along with the number of costumers.
Methodology Summary • Index type: Laspeyres - Quantum • Base: Average 2003 = 100 • Physical units: • Electricity: Gig watt/hour of establishments distributors of electricity • Gas: Cubic meter of establishments distributors of pipe gas • Potable water: Cubic meter of establishments distributors of potable water including cooperatives • Weights: relative prices year 2003 (To be updated every 5 years starting 2008) • Classification: Central Product Classification (CPC) • Pipe Gas - 12020 • Potable water – 18000 • Electric energy - 17100 • Coverage: National and regional (15 Regions) • Periodicity: monthly (disseminated with two months delay due to delivery time of the basic information from the sources: SEC and SISS)