Download
1 / 38
390 likes | 599 Views
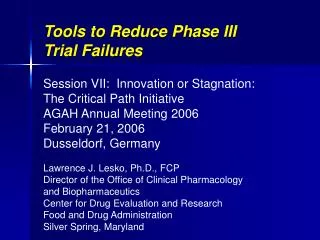
Tools to Reduce Phase III Trial Failures. Session VII: Innovation or Stagnation: The Critical Path Initiative AGAH Annual Meeting 2006 February 21, 2006 Dusseldorf, Germany. Lawrence J. Lesko, Ph.D., FCP Director of the Office of Clinical Pharmacology and Biopharmaceutics

E N D
Tools to Reduce Phase III Trial Failures Session VII: Innovation or Stagnation:The Critical Path InitiativeAGAH Annual Meeting 2006February 21, 2006Dusseldorf, Germany Lawrence J. Lesko, Ph.D., FCP Director of the Office of Clinical Pharmacology and Biopharmaceutics Center for Drug Evaluation and Research Food and Drug Administration Silver Spring, Maryland
Overview • The productivity problem to be solved by critical path initiative • Critical path opportunities that can influence early drug development and regulatory decisions
General Agreement on the Problem to Fix: Rising Costs Data from JAMA, Sept 21, 2005; NIH, and PhRMA Annual Surveys
But New Drug Applications Are Not Rising at the Same Rate Data from FDA; beginning in 2004, numbers include BLAs transferred from CBER to CDER
Barrier to Improving Productivity is the High Attrition Rate Kola and Landis, Nature Review Drug Discovery, 2004 (3):711-715
Driver for Industry to Seriously Commit to Critical Path Concepts “We are an industry with a 98% failure rate…..The only thing we have to do to double our success rate is to drop our failure rate by 2%” Hank McKinnell, Pfizer CEO, at http://www.bio-itworld.com, 2/14/06
Why Drugs Fail in Development: Root Cause Analysis is Needed Kola and Landis, Nature Review Drug Discovery, 2004 (3):711-715
Shift Failures Earlier: Quick Win – Quick Kill Paradigm “50% of phase 3 studies fail in 2005 as compared to 35% in 1997”* Predicting phase 3 clinical outcomes from phase 2 study results is no better than a coin flip * From PhRMA at http://www.pharma.org
Phase 3 Trials Have Become Larger and More Costly Dimasi et al, J Health Economics, 2003 (22): 151-185
Earnings of Major Industries For 2000-2005 Banks 17.3 Pharmaceuticals 16.2 Real Estate 10.8 Health Care 7.7 Software Services 7.6 Oil and Gas 5.8 Cents / Dollars of Sales Paradox of Decreased Productivity: Sustained Profitability (Inertia to Change) From Federal Government API Calculations and Price Waterhouse-Coopers LLP, Reported February 8, 2006
Product Life Cycles Flexibility Pricing Blockbuster Market Patent Expirations R&D Productivity Shrinking Fixed Pricing Segmented Market Increasingly Important Absolutely Essential Pillars of Industry Profitability: Changing Fundamentals Adapted in Part From a Presentation by Dr. Eiry W. Roberts, Lilly
The FDA Critical Path Initiative: An Opportunity to Change • Goals • To develop new predictive “tools” and bring innovation into the drug development process • To improve the productivity and success of drug development • To speed approval of innovative products to improve public health http://www.fda.gov/oc/initiatives/criticalpath/whitepaper.html
Progress Is Steady But Slow: Widespread Recognition of Barriers • FDA role is largely to act as an enabler, convener or stimulator of critical path • Agency does not have staff exclusively dedicated to critical path initiatives • Research must be spearheaded by outside non-profit consortium (few academic rewards) • 2006 budget is supposed to have $10 million dollars allotted to critical path • Drug companies must be persuaded to share their data and pool information (concerns about IP) • FDA has been distracted with safety issues
Office of ClinicalPharmacology Virtual Officeof Critical Path Initiatives Office of Biostatistics Office of the Commissioner Office of New Drugs Need for New Organizational Paradigms: Formation of New FDA “Super Office” To be completed by June 2006
Other Changes in FDA Infrastructure to Achieve Critical Path Goals • CDER-wide centralized consulting groups • Pharmacometrics (applying quantitative methods) • QT protocols, analysis of thorough QT studies • Pharmacogenomics, diagnostics and VGDS • Pediatric written requests, data analysis, and exclusivity • New interface opportunities with industry • End-of-phase 2A meetings • New information management system using CDISC standards and data warehousing • Fellowship and sabbatical opportunities • “Soft skill” training in negotiation and communication
One of the First Products of Critical Path: Exploratory IND Guidance • Exploratory IND precedes traditional IND to reduce time/resources on molecule unlikely to succeed (“quick kill” concept) • Conduct early in phase 1 • Very limited human exposure (e.g., < 7 days) • No therapeutic intent • Preclinical toxicology and CMC requirements scaled to type of study (e.g., microdosing) • Flexible clinical stop doses January 6, 2006; http://www.fda.gov/cder/Guidance/7086fnl.htm
Focus on Clinical Pharmacology Efforts in Critical Path Initiative • Areas of greatest potential gain • Improve predictions of efficacy and safety in early drug development • Biomarkers ~ better evaluation tools • General biomarker qualification, qualifying disease specific biomarkers • M&S ~ better harnessing of bioinformatics • Disease state models, clinical trial simulation • Clinical trials ~ improving efficiency • Enrichment designs, adaptive trial designs
Biomarkers: Classic Thinking Inhibits Their Development • Overemphasis on surrogate endpoints as an objective confounds biomarker development • Uncertainty over what is needed for “validation” and difficulty in getting “validation” data frustrates progress • Need to reassess the idea of “validation” perhaps to “qualification” • Regulatory agencies have focused to much on empirical testing of treatment vs placebo • Skewed research away from mechanistic biomarkers that would provide a better understanding of clinical evaluation • Provide incentives to use biomarkers throughout preclinical and clinical development
One Incentive: Show How Biomarkers Benefit in Regulatory Decision-Making October 3, 2005, Volume 67, Number 40, Page 15 • “Pharmacometrics Can Guide Future Trials, Minimize Risk -- FDA Analysis” • 244 ~ number of NDAs surveyed in cardio-renal, oncology and neuropharmacology • 42 ~ NDAs with pharmacometric (PM) analysis** • 26 ~ PM pivotal or supportive of NDA approval • 32 ~ PM provided evidence for label language ** Number not higher because sponsor application lacked necessary data
Re-emphasize 5 Fundamental Principles to Greatly Improve Biomarker Predictions • Develop reliable standards for the technology and analyte being measured • Clearly state the intended use of the biomarker, i.e., what is the question? • Define the necessary performance expectations and assumptions to make a binary decision • Express biomarker predictions in terms of probabilities of seeing clinical outcome of interest, i.e., inform decisions • Evaluate the cost and benefit of biomarker development vs alternative approaches, i.e., when does it really make a difference
Example: Can EGFR Expression Distinguish Between Aggressive and Non-Aggressive Pancreatic Tumors? • What is the definition of overexpression and how is this related to the technology platform used (quality)? • What is the definition of aggressive? Locally advanced or metastatic? Survival of 3 months or 6 months? • What kind of performance attributes are required? Is a PPV ~ 90% to distinguish between aggressive and non-aggressive acceptable? How about 75%? • Is it necessary to predict aggressiveness for patients that received combination therapy with gemcitabine or not? • What endpoint will I use to link clinical outcome to EGFR overexpression? Tumor size? Progression-free survival?
FDA-NCI Collaboration: Develop Such a Grid for Biomarkers Used in Cancer Drug Development • Defined most important primary and secondary oncology biomarkers and how they are used • Primary list • 4 kinases (VGEF, EGFR, PISK/Akt and Src) • 1 cell surface antigen (CD20) • Secondary list • 3 kinases (JaK, ILK, cell cycle checkpoints) • 2 cell surface antigens (CD30 and CTLA-4) • Developing detailed performance specifications and plan conduct “gap” research • Couple with complimentary biomarkers, e.g., imaging to improve predictability of outcomes
Define Regulatory Framework for Technical Qualification of Biomarkers as Surrogates • Develop inventory of biomarkers used as surrogate endpoints for full approval, accelerated approval, supplements and for support of one-clinical-study approvals in each of CDER review divisions • What surrogate endpoint is being used and what is the required effect size, if there is any? • Which category of approval was it used for? • When was it first used, what was the exact claim that was granted, and what did the label say? • What was the evidence basis for reliance on a surrogate? • What other surrogate endpoints are under consideration?
Model-Based Drug Development: An Extension of Dose-Response • A mathematical, model-based approach to integrating information and improving the quality of decision making in drug development • Preclinical and clinical biomarkers • Dose-response and/or PK-PD relationships • Mechanistic or empirical disease models • Clinical trial simulations and probabilities of success • Baseline-, placebo- and dropout-modified models • Ten disease models created internally including HIV-AIDS, osteoarthritis, alzheimers, parkinsons and pain • Exploring feasibility of creating a public space where models can be shared and grown
Patient Co-Variates Placebo Response Build a Drug Disease Model: Example of HIV/AIDS Mechanistic Model of DiseaseEx: HIV/AIDS Mathematical Model of Dose – Conc. (PK)Ex: HIV, viral load vs. time Biomarkers of EfficacyEx: viral RNA over time Biomarkers of SafetyEx: GIT events over time D/R and/or PK/PDEx: viral RNA and GIT events as f ( E, t) Biomarkers (clinical outcome) Over Time
Example: New CCR5 Inhibitor • D/R for efficacy from 0.5 to 6 mg BID • Co-administered with Kaletra 400 mg/100 mg • Risk • Severe GI events increased at higher doses • Benefit • Patient co-variates, resistance, drop-outs, non-compliance • Question to be asked • How can optimal dosing and study design be determined after 4 weeks in order to predict phase 2B trial outcome at 48 weeks?
p d2 PI Active Infected l fAbVT CD4+ Cells (N)NRTI Virus a + fLbVT Latent Infected (N)NRTI d1 c d3 Built Dynamic Viral Disease Model Using Literature, In-House Data, Information Provided Voluntarily by Companies l:production rate of target cell d1: dying rate of target cell c: dying rate of virus b: infection rate constant d2: dying rate of active cells d3: dying rate of latent cells p: production rate of virus J Acquir Immun Defic Syndr 26:397, 2001
2 mg QD 4 mg QD 2 mg BID 6 mg BID Differentiated Dosing and Study Designs by Simulating Viral Load Over Time
20% 21% 59% Simulating 20 Clinical Trials with 50 Patients per Group to Estimate Probability of “Picking the “Winner”* % of Simulated Trials Achieving Target Efficacy Outcome 1 mg BID 2 mg BID 4 mg OD * 2 log drop in viral RNA
Tipranavir: Good Biomarker Work Informs Drug Development and Therapeutics • Non-peptidic protease inhibitor for experienced patients or patients with virus resistance to other PIs • Plasma TPV levels ~ major driver of efficacy and toxicity, boosted with ritonavir (RTV) • HIV-1 protease mutations ~ major driver of resistance and decreased efficacy • 500/200 TPV/RTV dose selected for phase III • Plasma TPV levels > IC50 to suppress viral load and avoid development of resistance • Inhibitory quotient, IQ, predicts responders after 24 weeks • IQ = Cmin / [Wild Type IC50 x 3.75] See The Pink Sheet, June 30, 2005
Impact of IQ on 24-Week Viral Load Response and Cmin on Liver Toxicity Benefit: Viral Load Change From Baseline (log10) Risk: Grade 3-4 ALT, AST or Bilirubin From Dr. Jenny Zheng (OCPB), FDA Antiviral Drug AC Meeting, May 19, 2005
Translation of Information to Approved Label “Among the 206 patients receiving APTIVUS-ritonavir without enfuvirtide…..the response rate was 23% in those with an IQ value < 75 and 55% with an IQ value > 75.” “Among the 95 patients receiving APTIVUS-ritonavir with enfuvirtide, the response rate in patients with an IQ < 75 vs. those with IQ > 75 was 43% and 84% respectively.”
Pharmacogenomics Critical Path Opportunity for Innovative Adaptive Trial Design
Focus on Phase II/III Randomized Controlled Trials of Targeted Medicines • Several innovative clinical trial designs and statistical methodogies that increase efficiency ~ focus on “right patients” • adaptive • Predictive assay to identify binary outcomes (e.g., response) not available before trial • enrichment • Predictive assay to identify binary outcomes (e.g., response) known before trial (a priori) • stratification • Predictive assay to identify a range of outcomes (e.g., response) known before trial
Improving Efficiency: Prospective Evaluation of a Predictive Biomarker in a Phase 3 RCT Without Compromising Evaluation of Overall Effect Freidlin and Simon, Clin Can Res 2005, 11:7872-7878
Prospectively define N in first and second stage Preserve ability to detect overall effect as well as effect in sensitive subset if overall effect is negative As efficient as traditional designs to detect overall benefit to all patients Reduce chance of rejecting an effective medicine if only effective in sensitive subset More stringent significance level at stage 1 (0.04 vs 0.05) Context for use is looking at anticancer drugs but applicability to other areas may be limited Examine timeframe for identifying test at Stage 1 (e.g. vs earlier biomarkers) Disease pathophysiology less established than tumor behavior Confirmatory Adaptive Design: Features
Summary: Integrating Use of Tools Along the Critical Path Continual Reduction in Uncertainty in Benefit/Risk Toolkit for Improving Success in Drug Development Biomarkers: Prognostic, PD and Predictive Patient Selection Criteria Drug and Disease Modeling Dose Response, PK-PD and Dosing Targeted Label Information Optimal Use Adaptive Trial Design
Thanks for your attention lawrence.lesko@cder.hhs.gov