Download
1 / 68
680 likes | 783 Views
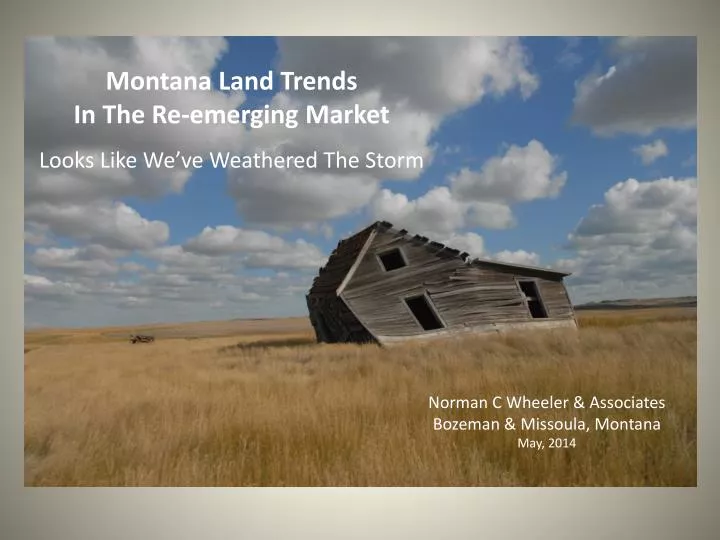
Montana Land Trends In The Re-emerging Market Looks Like We’ve Weathered The Storm. Norman C Wheeler & Associates Bozeman & Missoula, Montana May, 2014. Please Note: Opinions Ideas Observations Shameless Projections Values or Scenarios These are of a small minded appraiser and

E N D
Montana Land Trends In The Re-emerging Market Looks Like We’ve Weathered The Storm Norman C Wheeler & Associates Bozeman & Missoula, Montana May, 2014
Please Note: Opinions Ideas Observations Shameless Projections Values or Scenarios These are of a small minded appraiser and may not be coherent or representative of those who govern over us.
The Land Ranch market is re-emerging What is the Market Rewarding? Productivity & Good Buys Not Speculative Development or Values Not the best environment for beneficial Conservation Easement valuation.
Historically The “Other Market” One Market
Note – this is the Western Land Survey 2004 verses 2013
Lowest Price Point on Average since 1990s
Bifurcation Analysis 2012 vs. 2013 2012 was $776 per acre overall 2013 was $1,164per acre overall Strong Value Influence Based on Commodity Prices
Listings: Quick Sample over 640 Deeded Acres January 2014 194,603 Acres $1,920 Per Acre Less IX Ranch 134,603 acres $2,309 on Average 2013 Market Average $1,164 Per Acre
And Then There’s Demographics • Who’s next behind the Boomers? • GenX’ers: born between roughly 1965 and ’82 ….now 31 to 48 yrs old. • Millennials: those following, now 18-30 yrs old Millennials GenX Source: BabyBoomer HeadQuarters – www.bbhq.com
So when looking at Montana’s Rural Land Markets now, post-RESET…. Millennials GenX Location and Highest & Best Use (Really) Matter Changing Matrix – Buyers Desires – Land Ethic
CE – Historically changes to H&B Use- Greater Native Range $600 Mountain Pasture $850 Riparian $6,500 CE – Historically Limited Change Irrigated – Pivot - $4,000 Features Productivity
Leases Typical Matrix Native Range Mountain Pasture Riparian Irrigated – Pivot - Buildings
Return 3.1% 3.4% 1%
2013 – Small Lands Analysis • 100 to 320 Deeded Acres – 24 Sales • $12,846,000 • 4,430 Deeded Acres • $2,900 per acre Improved • $2,348 Per Acre Unimproved • 321 to 1,000 Deeded Acres – 25 Sales • $24,167,843 • 14,076 Deeded Acres • $1,717 per acre Improved • $1,394 Per Acre Unimproved Appears to be an upside to selling smaller parcels Based on averages – averages Good
2013 Sales Water Amenity Properties 5,546 Deeded Acres - $20,550,000 $7,135 per acre - Improved $5,425 per acre - Unimproved Average 504 Deeded Acres
Water Class Values - 2013 Class One Water Class Two Water Land Value Per Acre- Overall $4,227 All Non CE Encumbered • Land Value Per Acre- Overall • $5,877 • Non CE - $6,460 • CE Encumbered - $3,958 • 38.73% Property Rights Adjustment
Madison Only - Riparian Trending 2003 2004-’05 2006-’07 2010-’13 No Sales $3,056 $4,301 $8,432 $8,536 Beaverhead Only - Riparian Trending 2003 2004-’05 2006-’07 2010-’13 No Sales $1,150 $2,385 $3,858 $5,896 Southwestern Montana River Trending • Madison County • Beaverhead County Not Appreciation – Changing Property Features Spring Creeks Averages Good
Recent River Site Data Trends2011 to 2013 • Average Site - 78.86 acres • Average Site - $810,000 • $10,272 per acre Unimproved • High Amenity • $914,000 • Lower Amenity • $595,000
2013 River Sites $20,550,00015 Sales – 1,427 Deeded Acres95.13 acres per site$1,370,000 Per Site - Improved$14,401 per acre overall
Average $960,000 Site/Land Value Only $10,091 Per Acre Unimproved
FCS –Southeastern Montana Ranches 2012 2013 Sales Volume $51,000,000 Deeded Acres 117,000 $436 Per Acre – Deeded (11.8% Increase) • Sales Volume $81,000,000 • Deeded Acres 208,000 • $390 Per Acre - Deeded
Eastern Montana – “The Other Market” Predominately Agricultural H&B Use 2005: $175 to $225 Per Deeded Acre 2010: $225 to $275 Per Deeded Acre 2010 - Emergence of N Bar Sale & Expanding Western Market Mid State - Spanning Two Market Areas More Recreational Influence - $400 to $500 Per Acre 2012: $350 to $400 Per Deeded Acre 2013: $435 to $496 Per Deeded Acre
Avg AU Rec Influence $ 11,730 Per AU Unimproved Avg AU Grass Ranch $ 8,043 Per AU Unimproved Avg AU Rec Influence $ 15,000 Per AU Unimproved Avg AU Grass Ranch $ 11,000 Per AU Unimproved Effect of Transitional Market On Animal Unit Values - 2010 Effect of Transitional Market On Animal Unit Values - 2012
What's Up with Appraisers Regulation began in 1990 Grandfathering Lack of Mentorship (intelligence) IRS Enforcement ( Intimidation) 2006 Overstatement Penalties - Sanctions Lack of Effective Support or Pushback By Appraisal Organizations
Report Formats USPAP YELLOWBOOK (One hand tied behind your back) QUAILIFIED IRS APPRAISAL (Two hands Tied behind your back)
Pushback was Limited Errors and Misleading Reports Flagged - Bad No Logical Defense No Real Standards in Place IRS Walk Over Appraisers & Land Trusts Subsequently Decreed Rules “Standard Procedures” Property Rights Adjustment Gutted for CE Valuation But Still Fully Acceptable for any other Damages Measurement Access Fire Environmental Virtually Whole Appraisal Practice is based on Property Rights Adjustment
USPAP (Follow the rules) 5 Standards of Practice & Incorporated Rules 10 Statements on Appraisal Standards 32 Advisory Opinions 316 Frequently Asked Questions
USPAP Report Credible Results in a Non Misleading Manner Based on Standard of your Peers As dictated By Your Experience/Ethics No Review – Until? Maybe Never Yellowbook Report all undeniable elements In a Supportable Format Review and acceptance by a qualified reviewer based on a statement of work IRS Qualified Appraise As Ordered Based on Non Regulated Rules Radom –based on unlicensed IRS Engineer Only Federal Agency that has not adopted USPAP
1-Larger Parcel Issues 2-Highest and Best Use 3-Valuation 4- Trends
Larger Parcel Unity of 1-Ownership 2-Location 3-Unity of Use 4- Highest and Best Use Mom & Pop CE Subject 640 Acres
Larger Parcel Mom & Pop CE Subject 640 Acres Unity of 1-Ownership 2-Location 3-Unity of Use 4- Highest and Best Use Mom and Pop 160 acres No CE
Yellowbook Before 800 acres After 640 Encumbered 160 Non – different H&B Use Mom & Pop CE Subject 640 Acres Mom & Pop CE Subject 640 Acres Mom and Pop 160 acres No CE USPAP 640 CE Subject - Encumbered Mom and Pop 160 acres No CE IRS – 800 acres Partially Encumbered With Analysis of Benefit to Remainder and Enhancements
Larger Parcel Unity of 1-Ownership 2-Location 3-Use Ex Son In-law Mom & Pop CE Subject 640 Acres Daughter Mom & Pop – No CE
Larger Parcel- USPAP Unity of 1-Ownership 2-Location 3-Use Ex Son In-law Mom & Pop CE Subject 640 Acres Daughter Mom & Pop – No CE
Larger Parcel- IRS Unity of 1-Ownership 2-Location 3-Use Ex Son In-law Mom & Pop CE Subject 640 Acres Daughter Now for IRS 920 acres Partially Encumbered Larger Parcel 640 encumbered Benefits Enhancements Mom & Pop – No CE
Larger Parcel- IRS Unity of 1-Ownership 2-Location 3-Use Ex Son In-law Mom & Pop CE Subject 640 Acres Daughter Son Now for IRS 920 acres Partially Encumbered Larger Parcel 640 encumbered Benefits Enhancements Mom & Pop – No CE
Highest & Best UseBefore Easement Legally Permissible Physically Possible Financially Feasible Maximally Productive
Legally Permissible Zoning Prior Easements Floodway Governmental Restrictions
Physically Possible Topography Access Floodway Size/Shape Soils
Financially FeasibleWhat Economic Use Supports Market Value KEY Probable Measurable Predictable
Agriculture Productivity Recreation Features Investment Quality Probable Interim Foreseeable Future Bullshit
Subdivision- OK Value Analysis Discounted Cash Flow NO-NO Bulk Sale Unhappy Client
Based on Buyer Logic: A = $100,000 - 20 Acre Lot Then regardless of input costs My 320 acres = 16 times $100,000 Or B - $1,600,000 $5,000 per acre CE Reserves 2 build sites and no division So After Value 2 times $100,000 = C- $200,000 D- (duh)= CE value $1,400,000 Joe Bag of Doughnuts Buys a 320 acre tract At market - say $1500 per acre Or $480,000