Download
1 / 17
190 likes | 304 Views
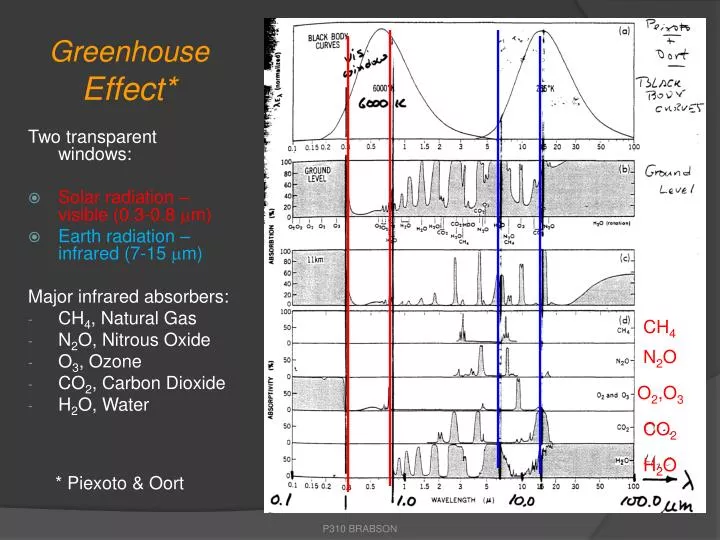
Greenhouse Effect*. Two transparent windows: Solar radiation – visible (0.3-0.8 m m) Earth radiation – infrared (7-15 m m) Major infrared absorbers: CH 4 , Natural Gas N 2 O, Nitrous Oxide O 3 , Ozone CO 2 , Carbon Dioxide H 2 O, Water. CH 4. N 2 O. O 2 ,O 3. CO 2. H 2 O.

E N D
Greenhouse Effect* Two transparent windows: • Solar radiation – visible (0.3-0.8 mm) • Earth radiation – infrared (7-15 mm) Major infrared absorbers: • CH4, Natural Gas • N2O, Nitrous Oxide • O3, Ozone • CO2, Carbon Dioxide • H2O, Water CH4 N2O O2,O3 CO2 H2O * Piexoto & Oort P310 BRABSON
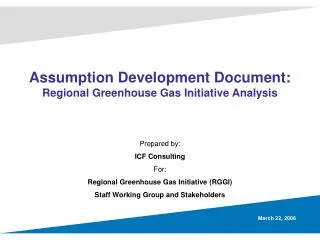
IPCC – AR5 – Sept. 2013 Executive Summary P310 BRABSON
2011 Mauna Loa CO2 Mauna Loa Monthly Mean CO2 in parts per million (ppm). August 2013: 395.15 ppm August 2012: 392.41 ppm National Oceanic and Atmospheric Administration (NOAA) http://www.esrl.noaa.gov/gmd/ccgg/trends/ P310 BRABSON
Last 1000 years of CO2 400ppm 280 ppm P310 BRABSON
Global Mean Surface Air Temperature to 2012 The graph shows global annual surface temperatures relative to 1951-1980 mean temperatures. 1.)The last decade was the hottest ever recorded. 2.)2010 is the hottest year since records have been kept. 3.) The red line shows the 5-year average: Long-term trends are more apparent. (Image credit: NASA/GISS) P310 BRABSON
J. Hansen et al.,Science 308, 1431, 2005. P310 BRABSON
The Millennial Temperature RecordJones, et al – Climatic Research Unithttp://www.cru.uea.ac.uk/cru/info/milltemp/ 1683 Medieval Warm Period Mini Ice Age • Proxies: Different choices of Northern Hemisphere proxies (trees, ice cores, corals, lake & marine sediments, and historical documents) • Natural forcing from sun and volcanoes dominate the pre-1850 record and only human activities appear to adequately explain the rise in temperature during the 20th century. P310 BRABSON
Global Mean Sea Level Andrew: There’s unprecedented flooding. Large parts of the country are underwater. The death toll is near half a million and rising. And it’s not just Bangladesh… There are people out there saying this is the end. Gabriel: The end of what? Male, Maldives Capital P310 BRABSON
Arctic Sea Ice AREA – September 29, 2013 Positive Feedback from increased absorption of solar energy by black water. Tipping point? 2007 IPCC projected ice free summers by mid-century 2012projections now as early as 2020 Open exploration for natural resources. P310 BRABSON
Greenland Arctic Sea Ice Volume Anomaly:Ice Melt May 31, 2011 Monthly anomaly relative to 1979-2010 Trend: -2.8 ± 1.0 in thousands of km3/decade. Extensive thinning of margins (-1.5m/yr red, +1.5m/yr blue) P310 BRABSON
Climate Change: An Impacts Summary • Open Arctic water in summer absorbs far more solar energy than when ice-covered. [Positive feedback] • Sea Level Rise 1.) Melting ice sheets in Greenland, Antarctica 2.) Expanding water volume • Snow pack in Rocky Mountains, Himalayan Mountains summer drought in downstream areas. • Thresholds, when crossed, make rapid transitions: • Fresh water melting into the North Atlantic slows the Gulf Stream • Ocean surface temperature above 27oC increased hurricane severity. P310 BRABSON
Observed GHG Emissions and Emission Scenarios Each Emissions Scenario is a guess about our future carbon production Peters et al. 2012a; Global Carbon Project 2012 http://www.globalcarbonproject.org/carbonbudget/index.htm 4.0-6.1°C 2.6-3.7°C 2.0-3.0°C 1.3-1.9°C
Geoengineering Effectiveness vs. Affordability Timeliness [Fast/Slow] Safety [Low/Medium/High P310 BRABSON
Geological Carbon Sequestration • John Rupp, Indiana Geological Survey, Bloomington • Supercritical fluid above 70 bar • Indiana: ¼ GT/year CO2 • Potential Indiana sites: • Oil/natural gas formations • Secondary oil/gas recovery • Relatively small volumes • Coal seams • Surface chemistry • Relatively small volumes • Saline aquifers (25-60 GT) • Potentially large volumes • Pore size decrease with depth • High pressure fracture • Permeability vs. Porosity P310 BRABSON
Feedback in Climate[Or why we need models] T T Positive feedback example: A warmer surface temperature reduces the size of the highly reflective polar ice fields. The less reflective soil or open ocean absorbs more solar radiation increasing the surface temperature even further. Negative feedback example: T T A warmer surface temperature evaporates additional water forming more cloud. The cloud layer reflects incoming solar energy, reducing the surface temperature. Climate Models P310 BRABSON