Download
1 / 22
220 likes | 351 Views
Evaluation of Satellite NO2 Stratospheric Columns with the SAOZ/NDACC UV-Vis Network. J.-P. Pommereau 1 , F. Goutail 1 , A. Pazmino 1 , D. Ionov 1,3 , F. Hendrick 2 , and M. Van Roozendael 2. [1] LATMOS, CNRS, and University of Versailles Saint Quentin, Guyancourt, France

E N D
Evaluation of Satellite NO2 Stratospheric Columns with the SAOZ/NDACC UV-Vis Network J.-P. Pommereau1, F. Goutail1, A. Pazmino1, D. Ionov1,3, F. Hendrick2, and M. Van Roozendael2 [1] LATMOS, CNRS, and University of Versailles Saint Quentin, Guyancourt, France [2] Belgian Institute for Space Aeronomy (BIRA-IASB), Brussels, Belgium [3] Department of Atmospheric Physics, St. Petersburg State University, Russia
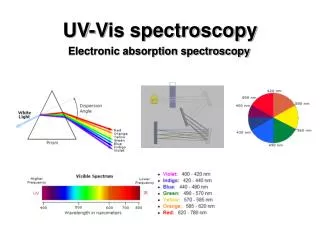
NO2 more complex than ozone for several reasons • Tropospheric contribution larger than for O3 • (PBL pollution, Lightning NOx in UTLS) • Limited information on profile climatology below • 20 km and during polar permanent day and night • (models little representative of the troposphere) • Photochemical diurnal variation ESA ACVE March 2013
SAOZ NO2 following NDACC UV-Vis WG recommendations • Slant columns at sunrise and sunset by zenith sky observations between 86°-91°SZA • NO2 cross-sections at low temperature (Vandaele et al.) • Slant converted into vertical columns using Air Mass Factors (AMF) calculated from IASB-BIRA zonal climatologies ESA ACVE March 2013
SAOZ network selected stations Arctic Antarctic Mid-Lat Tropics ESA ACVE March 2013
SAOZ NO2 PROFILES CLIMATOLOGY AMF BIRA-IASB look-up tables from: • Satellite profiles HALOE, POAM III above 20 km (Lambert et al. 2000) • Complemented below 20 km by SAOZ-B short and long duration balloon profiles at high and middle northern latitudes and the southern tropics Ex: northern mid-latitudes Sunrise Sunset ESA ACVE March 2013
Comparison with SATELLITES GOME GDP4, SCIAMACHY Strato (IUPB), OMI Strato (NASA), GOME 2 Strato (IUPB) • Satellites: nadir viewing, subtraction of modelled tropospheric NO2, correction for clouds (Ghost column) • SAOZ zenith sky observations less sensitive to PBL tropospheric pollution ESA ACVE March 2013
Correction for diurnal photochemical variation GOME2 • 1D Photochemical model simulations (stratosphere only) • Latitude and seasonal dependence • Satellites columns normalised to SAOZ sunrise column at 90°SZA ESA ACVE March 2013
ARCTIC: Scoresbysund Greenland (never polluted) Original data Diurnal variation corrected Satellites lowbiasedcompared to SAOZ in summer ESA ACVE March 2013
SCORESBYSUND Correlation SAT NO2 / SAOZ NO2 Larger noise on GOME Not linear. Different behaviour at low and high NO2 ESA ACVE March 2013
EXPLANATION: SZA DEPENDENCE All satellites cut at SZA>85° GOME lessdependent but noisy Overestimation at high sun, underestimation at low sun (Not SAOZ since always same SZA) GOME lessdependent but noisy ESA ACVE March 2013
But why underestimation of satellite columns in the summer? SZA at OMI overpass Summer measurements at low sun! From ascending orbit at 21 loc during permanent day instead of descending orbit at 9 loc. Diurnal variation correction wrong.
DUMONT D’URVILLE Satellites lowbiasedcompared to SAOZ
DUMONT D’URVILLE SZA DEPENDENCE
GOME and OMI high biased in summer, SCIA better but low biased in winter Mid-Latitude: Kerguelen (never polluted) ESA ACVE March 2013
SZA DEPENDENCE But in contrast to polar areas: high sun in the summer and low sun in the winter (daytime orbit only) ESA ACVE March 2013
Mid-Latitude: OHP (PBL frequently polluted) All satellites larger and noisier than SAOZ ESA ACVE March 2013
SZA DEPENDENCE Similar to Kerguelen but larger summer high bias and noise on all satellites Nadir viewing more sensitive to PBL than zenith sky SAOZ
Pastel PhD thesis 2011 TROPICS Larger SAOZ column in Bauru compared to Reunion (LNOx during thunderstorm summer, biomass burning and urban pollution in the winter) ESA ACVE March 2013
Nitrogen Dioxide zonal anomaly between 10-20°S in the summer seen from a circum-navigating long duration ballon LNOx LNOx BAURU REUNION Maximum over Africa and S.America Pommereau 2007
Satellites: no difference between Bauru and Reunion Agreement SAT/SAOZ (except GOME) (tropospheric NO2 consistent) All SAT larger than SAOZ, particularly OMI (wrong tropospheric NO2)
SZA DEPENDENCE Bauru Reunion Smaller SCIA and GOME2 stratospheric columns: Tropospheric ozone overestimated. Larger stratospheric columns: Tropospheric ozone underestimated (particularly OMI and GOME)
SUMMARY • Systematic seasonal differences (up to 30%) between satellites and SAOZ at all latitudes, attributed to: • SZA dependences of SAOZ- satellites difference (OMI largest, GOME smallest). Improved correction for diurnal variation and profiles climatology required. • Errors in tropospheric contributions estimations • Tropospheric contribution very difficult to separate in nadir observations