Download
1 / 19
190 likes | 278 Views
Explore a draft of guidelines focusing on ranking ecological benefits based on quantitative and subjective inputs. Learn how to weigh objectives, score PMs, and select preferred alternatives to maximize systemwide restoration goals.

E N D
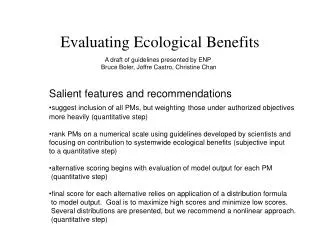
Evaluating Ecological Benefits A draft of guidelines presented by ENP Bruce Boler, Joffre Castro, Christine Chan • Salient features and recommendations • suggest inclusion of all PMs, but weightingthose under authorized objectives • more heavily (quantitative step) • rank PMs on a numerical scale using guidelines developed by scientists and • focusing on contribution to systemwide ecological benefits (subjective input • to a quantitative step) • alternative scoring begins with evaluation of model output for each PM • (quantitative step) • final score for each alternative relies on application of a distribution formula • to model output. Goal is to maximize high scores and minimize low scores. • Several distributions are presented, but we recommend a nonlinear approach. • (quantitative step)
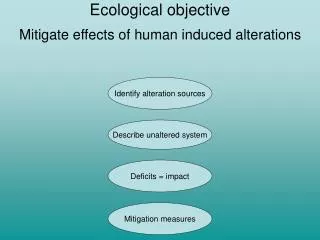
EVALUATE ALTERNATIVES RANK PMs SELECT PREFERRED ALTERNATIVE
RANKING OF PM 1. Compile list of PMs 2. Classify PMs according to objectives (or functional category) 3. Weight objectives (authorized vs. additional) 4. For each objective: a) score PMs (science experts) b) derive partial weights 4. Compute overall weights (PM partial weight X objective weight)
WEIGHT 1 1 1 1 1 1 1 0.5 = 7.5 Objectives • Ecosystem Restoration in TS and EPh • ENP Natural Values • Damaging Freshwaters Flows • Flood Protection for C-111 Basin • East Everglades Mitigation • Quality of Waters Diverted to ENP • Water Deliveries into ENP • Additional Objectives In this example, the 7 authorized objectives carry a weight of 1, while the additional objectives carry a collective weight of 0.5. Final weights to be determined by the PDT.
Score the PMs. How important is each one to totalsystem restoration? • Develop a scoring system (e.g., 1-10) • Develop guidelines, or classification system, for the scoring system. See following slides for examples • Guidelines should consider each PM’s contribution within the larger context of the combined authorized objectives. • Scoring system, guidelines, and scoring should be accomplished by scientific experts
PARTIAL WEIGHT • Marl Prairie Habitat • Spatial Distribution of marl- forming wetlands • Fish and invertebrates • Fish and invertebrates • Marl prairie vegetation Score 4 PM1 (4/45)*100=9 PM2 7 16 9 20 PM3 2 4 PM4 • Slough Habitat • Fish and invertebrates • Fish and invertebrates • Fish and invertebrates PM5 1 2 18 PM6 8 3 7 PM7 • Sawgrass Plains Habitat • Spatial Distribution of marl-forming wetlands PM8 5 11 6 PM9 13 = 45 = 100 Obj. 1: Ecosystem Restoration in TS and EPh
WEIGHTING PMs: multiply partial weight by objective weight TOTAL WEIGHT PARTIAL WEIGHT 9 x 1 PM1 9 9 PM2 16 16 Partial weight PM3 20 20 PM4 4 4 PM5 2 2 PM6 18 18 7 7 PM7 11 11 PM8 13 13 PM9 Objective weight
EVALUATE ALTERNATIVES RANK PMs SELECT PREFERRED ALTERNATIVE
SCORING ALTERNATIVES Each alternative is scored according to model output, for each PM, as follows: a)populate table with model output b) score alternatives (see green button on next page for scoring schemes)
ALTERNATIVES For scoring schemes -->
Alternative Selection 1. Create summary table with results: a) list PM’s ( 1st. column) b) list alternatives (top row) 2. Populate table a)PM weight X alternative score b) obtain columnwise alternative totals 3. Select alternative with the highest score
PM1 9 PM2 16 PM3 20 PM4 4 PM5 2 PM6 18 7 PM7 11 PM8 13 PM9 (partial weight X objective weight) PM’S WEIGHTS ALTERNATIVE SCORES Multiply each PM weight by alternative scores to reach final score
SCORE OF 9 FULLY SUPPORTS ONE OR MORE SYSTEM-WIDE RESTORATION OBJECTIVES, INCLUDING INCREASING THE TOTAL SPATIAL EXTENT OF NATURAL AREAS, IMPROVING HABITAT AND FUCTIONAL QUALITY, AND IMPROVING RELATIVE PLANT AND ANIMAL SPECIES ABUNDANCE AND DIVERSITY.
SCORE OF 7 PROVIDES IMPROVEMENTS IN ECOLOGICAL FUNCTIONS; HOWEVER, IMPROVEMENTS ARE LESS THAN OPTIMAL AND/OR TOO LOCALIZED TO SIGNIFICANTLY SUPPORT SYSTEM-WIDE RESTORATION.
SCORE OF 4 Guidelines for assigning a score of 4: should be expanded from the example given here, and developed by scientists MAINTAINS EXISTING ECOLOGICAL FUNCTIONS, BUT DOES NOT ENHANCE SYSTEM-WIDE ECOLOGICAL FUNCTIONS.
SCORE OF 1 DOES NOT SUPPORT ECOLOGICAL FUNCTIONS, LOCALLY OR SYSTEM WIDE
SCORES Alternative score Model output (e.g., number of acres)