Download
1 / 1
10 likes | 150 Views
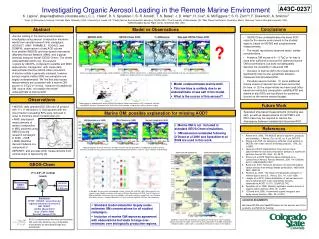
A43C-0237. Investigating Organic Aerosol L oading in the Remote Marine Environment K. Lapina 1 , (klapina@atmos.colostate.edu ), C. L . Heald 1 , D. V. Spracklen 2 , S. R. Arnold 2 , T. S. Bates 3 , J. D. Allan 4 , H. Coe 4 , G. McFiggans 4 , S. R. Zorn 5,6 , F. Drewnick 5 , A. Smirnov 7

E N D
A43C-0237 Investigating Organic Aerosol Loading in the Remote Marine Environment K. Lapina1, (klapina@atmos.colostate.edu ), C. L. Heald1,D. V. Spracklen2, S. R. Arnold2, T. S. Bates3, J. D. Allan4, H. Coe4, G. McFiggans4, S. R. Zorn5,6, F. Drewnick5, A. Smirnov7 1Dept. of Atmospheric Science, Colorado State University, USA, 2University of Leeds, UK, 3Pacific Marine Environmental Laboratory, NOAA,USA , 4The University of Manchester, UK, 5Max Planck Institute for Chemistry, Mainz, Germany, 6now at Harvard University, USA, 7NASA/Goddard Space Flight Center, Greenbelt, MD, USA Conclusions Abstract Model vs Observations Aerosol loading in the marine environment is investigated using aerosol composition measure-ments from several research ship campaigns (ICEALOT, MAP, RHAMBLE, VOCALS and OOMPH), observations of total AOD column from satellite (MODIS) and ship-based instruments (Maritime Aerosol Network, MAN), and a global chemical transport model (GEOS-Chem). The model underestimates AOD over the oceanic regions by 40±20%, compared to satellite and MAN observations. Comparison with cruise data demonstrates that the GEOS-Chem simulation of marine sulfate is generally unbiased, however surface organic matter (OM) concentrations are largely underestimated. We find that ship-based measurements are consistent with a marine OM source of 9 TgC yr-1or less, however this additional OM source does not explain the model underestimate of marine AOD. • GEOS-Chem underestimates the mean AOD value for the marine environment in the studied regions, based on MODIS and sunphotometer measurements. • The model reproduces observed mean sulfate concentrations. • A marine OM source of 8 – 9 TgCyr-1or less is more than sufficient to account for observed marine OM concentrations, but does not adequately describe the variability in observed OM. • Inclusion of marine OM in the model does not significantly improve the agreement between measured and simulated AOD. • Possible reasons include: (1) some additional marine source of aerosol has not been accounted for here, or (2) the observations we have used (ship-based non-refractory composition, satellite AOD and • marine in-situ AOD) are insufficient for achieving closure on the marine aerosol budget. 2ox 2.5o,47 vertical levels ? Meteorology GMAO GEOS-5 Aerosol extinction @ 550 nm Emissions FF/BF: EDGAR, overwritten by regional emission inventories BB: GFED2 OC/BC (Bond 2007) Dust (Fairlie 2006) Sea Salt (Jaegle 2010) Annual average aerosol optical depth (AOD) at 550 nm in 2007 for MODIS, GEOS-Chem, % difference (GEOS-Chem minus MODIS) and sea salt component of GEOS-Chem. Model was sampled at the time and location of MODIS overpass. • Model underestimates marine AOD. • This low bias is unlikely due to an underestimate of sea salt in the model. • What is the source of this aerosol? Observations Scatter plot of a) modeled AOD and b) MODIS AOD against MAN measurements (SP), sampled to coincide with MODIS overpass. Data points with AOD>0.6 are not included in regression analysis and are in grey. Future Work • MODIS: daily gridded AOD (550 nm) v5 product with 1o x 1o resolution [1]. Grid squares with the cloud fraction exceeding 80% were removed in order to minimize cloud contamination [2]. Speciated ship-based measurements (including sea-salt), as well as measurements of total PM10 and PM1 mass may be required to resolve the discrepancy between modeled and observed AOD. Marine OM: possible explanation for missing AOD? • AMS: ship-based measurements of aerosol composition • in MBL obtained using AMS [3] during research campaigns • in 2006 – 2008. • MAN: Maritime Aerosol Network is a component of • Marine OM is not included in standard GEOS-Chem simulations. • OM emissions estimated following O’Dowd et al 2008 and Spracklen et al 2008 are used in this work. References • Remer et al. 2005, The MODIS aerosol algorithm, products, and validation, J. Atmos. Sci, vol. 62, no. 4, pp. 947-973 • Zhang et al 2005, An analysis of potential cloud artifacts in MODIS over ocean aerosol thickness products, GRL, 32, L15803 • Jayne et al 2000, Development of an aerosol mass spectrometer for size and composition analysis of submicron particles, Aerosol Sci. Tech., 33, 49-70 • Smirnov et al 2009. Maritime Aerosol Network as a component of Aerosol Robotic Network, JGR, 114, D06204, doi:10.1029/2008JD011257 • Bond et al. 2007, Historical emissions of black and organic carbon aerosol from energy-related combustion, 1850-2000, GBC, GB2018 • Fairlieet al., 2007, The impact of transpacific transport of mineral dust in the U.S. , Atmos. Env., 41, 1251-1266 • Jaegle, et al 2010, Global distribution of sea salt aerosols: new constraints from in situ and remote sensing observations,ACPD, 10 (11), 25,687-25,742, • Spracklen et al. 2008, Globally significant oceanic source of organic carbon aerosol, GRL, 35, L12811 • O'Dowd et al 2008, A combined organic-inorganic sea-spray source function, GRL, 35, L01801 MAN sampling locations Global distribution of annual emissions for 2007 of marine OM by Spracklen et al 2008 (left) (based on [Chl-a]), O’Dowd et al 2008 (center), (based on [Chl-a] and meteorological parameters), and sea salt by Jaegle et al 2010 (right). • AERONET, and provides AOD measurements from various ships of opportunity [4]. a) b) GEOS-Chem a) Boxplots for measured and modeled surface sulfate (left) and OM (right). Measurements are shown in grey. Model simulations with marine OM from Spracklen et al 2008, from O’Dowd et al 2008 and without marine emissions are plotted in red, green and blue, respectively. b) Latitudinal distribution (means ± standard deviations) of measured and modeled OM from ship campaigns. ACKNOWLEDGEMENTS We thank MODIS and SeaWIFS teams for the aerosol and Chl-a products, and NASA for funding. • Standard model simulation largely under-estimates OM concentrations for all studied campaigns. • Inclusion of marine OM improves agreement with observations but leads to large over-estimates over biologically productive regions. AOD is computed from the mass concentration (M), extinction efficiency (Qext) and particle mass density for each particle type and wavelength. Modeled surface OM concentration averaged over the period of each campaign without (left) and with (right) marine OM source by Spracklen et al 2008 overlaid with OM observations. Color scale is saturated at the maximum values in the legend.