Download
1 / 16
170 likes | 380 Views
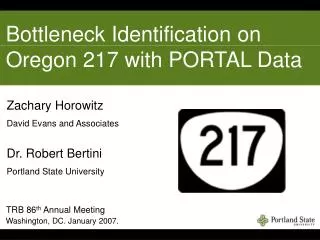
Bottleneck Identification and Calibration for Corridor Management Planning. Xuegang (Jeff) Ban Lianyu Chu Hamed Benouar California Center for Innovative Transportation (CCIT) University of California – Berkeley January 22, 2007. Outline. Introduction Bottleneck Identification

E N D
Bottleneck Identification and Calibration for Corridor Management Planning Xuegang (Jeff) Ban Lianyu Chu Hamed Benouar California Center for Innovative Transportation (CCIT) University of California – Berkeley January 22, 2007
Outline • Introduction • Bottleneck Identification • Bottleneck Calibration • A Real World Example • Concluding Remarks
Introduction • Corridor Management • Corridor Management Planning • Integrated Corridor Management • Micro-simulation in Corridor Management • Performance Evaluation • Improvement Scenario Evaluations • Bottleneck Analysis • Definition: Locations that capacity less or demand greater than other locations. • Identification: Queue length and duration • Calibration in Micro-simulation
Bottleneck Identification • Current Practice • HICOMP, PeMS • Proposed Method • Binary Speed Contour Map (BSCM) via Percentile Speeds • Assumption: bottleneck area if v<=vth • Why are Percentile Speeds? • Probability of a location being a bottleneck • Flexibility of identifying bottlenecks • Reliability compared with single “typical” day or average speeds p-th percentile speed
Bottleneck Identification (Cont.) • Speed Contour Map • Represented as S(i, t) Incident Average 15% No-Incident 50% 85%
Bottleneck Identification (Cont.) • Binary Speed Contour Map (BSCM) BS(i, t) = 1, if S(i, t) <= vth, 0, otherwise • Bottleneck(s) can be identified automatically via BSCM Vth = 35mph
Bottleneck Calibration • Current Practice • FHWA Micro-Simulation Guideline: Visual Assessment • Proposed Method - A Three Step-Process • 1. Visual Assessment • 2. Area Matching • 3. Actual Speed Matching • Three Levels of Details for Calibrating Bottlenecks
Step 1. Visual Assessment • Purpose • Make sure the number of bottlenecks, their locations and areas roughly match • Qualitative and no quantitative measures can be defined Observed Data Simulation Data
Step 2: Bottleneck Area Matching • Purpose • Match bottleneck locations and areas using BSCMs • Quantitative Measure C1 • Area Matching Criteria: C1 = 90.5% Union Area Overlapping Area
Step 3: Actual Speeds Matching • Purpose • Match Detailed Bottleneck Speeds using both SCMs and BSCMs • Quantitative Measure C2 • Actual Speed Matching Criteria: Observed Data Simulation Data Union Area C2 = 64.2%
A Real World Example • I-880 in the San Francisco Bay Area • One of the series of studies for Corridor Management Planning • On-going project and the results presented here are interim • The Example • I-880 NB, AM Peak hours (6:30 AM – 9:30 AM) • Observed data: 20 typical weekdays (Tuesday – Thursday) • Double loop detectors with spacing ¼ mile • Simulation Tool • Paramics
Calibration Results – Flow and Travel Time • Calibration is satisfactory for matching flow and travel times
Calibration Results – Bottlenecks • Bottlenecks? Observed Data Simulation Data
Calibration Results – Bottlenecks • Bottlenecks? C1= 24.2%, C2 =42.5% Simulation Data Observed Data
Concluding Remarks • Conclusions • Percentile speeds was used to conduct bottleneck analysis • Proposed an automatic bottleneck identification method based on binary speed contour maps • Developed a three-step process for bottleneck calibration: visual assessment, area matching, and actual speed matching • Defined quantitative measures for bottleneck calibration • Enhancement to current micro-simulation calibration practice • Future Study • Using data from single loops (occupancy) • Procedure for calibration