Corridor System Management
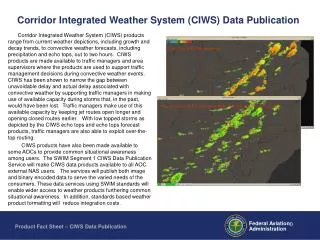
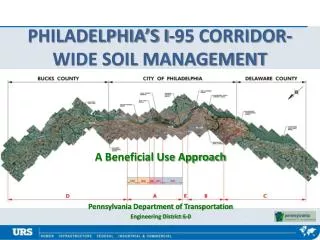
I-210 Corridor System Management Plan Stakeholders Kick-off Meeting September 25, 2007 System Metrics Group, Inc (SMG). Corridor System Management. 25 miles. I-5 to SR57. 20 miles. Corridor System Management. Corridor-wide Performance Focused. WB-210 @Lake. Speed. Flow.


Corridor System Management
E N D
Presentation Transcript
I-210Corridor System Management PlanStakeholders Kick-off MeetingSeptember 25, 2007System Metrics Group, Inc (SMG)
Corridor System Management 25 miles I-5 to SR57 20 miles
Corridor-wide Performance Focused WB-210 @Lake Speed Flow
Corridor-wide Performance Focused EB-210 @Citrus Speed Flow
Corridor-wide Performance Focused WB-210 @Baldwin Speed Flow Productivity drops by 30% when speeds drop below 30 mph (1 lane equivalent). Productivity picks up when speeds are above 40 mph.
Corridor-wide Performance Focused WB-210 @Santa Anita Speed Flow Productivity drops by 30% when speeds drop below 30 mph (1.5 lane equivalent). Productivity picks up when speeds are above 40 mph.
Corridor-wide Performance Focused WB-210 @Huntington Speed Flow Productivity drops by 30% when speeds drop below 30 mph (1 lane equivalent). Productivity picks up when speeds are above 40 mph.
Corridor-wide Performance Focused EB-210 @Huntington Speed Flow Productivity drops by 30% when speeds drop below 30 mph (1 lane equivalent). Productivity picks up when speeds are above 40 mph.
Base Performance Assessment (PeMS, TASAS, Other) Bottleneck Identification (HICOMP, PeMS, Aerial Photographs, CHP Logs, Other) Future Planned, Performance Improvement Programmed and (Micro-Simulation, Scenarios other Regional Models) Improvements Scenario Performance Evaluation (Micro and Meso Models) Recommendations and Performance Improvement Estimates CSMP Steps • Current Corridor-wide Performance Assessment • Bottleneck Identification • Baseline Model Development and Calibration • Future Model Development and Future Performance • Improvement Scenario Development and Evaluation • Recommended Improvements
CSMP Report Elements • BASELINE (2006) AND CURRENT (2007) CONDITIONS • Corridor-wide Performance Assessment • Bottleneck Identification and Causes • FUTURE YEAR (2020) MICRO-SIMULATION MODELING • Existing Projects Under Development • Existing Programmed and Planned Projects • Team Recommended Additional Mitigation Strategies • Future Project Scenarios • PREDICTED FUTURE CONDITIONS ASSESSMENT • Scenario 1 – X • Benefit-Cost • CONCLUSIONS AND RECOMMENDATIONS • Prioritized list of existing projects by benefit-cost • New projects
Reliability Productivity Safety Mobility 1. Corridor-wide Performance Assessment Performance
1. Corridor-wide Performance Assessment Congestion Delay
1. Corridor-wide Performance Assessment Congestion Delay
1. Corridor-wide Performance Assessment 2,070,000 vehicle-hours Congestion Delay 2,085,000 vehicle-hours
1. Corridor-wide Performance Assessment Travel Time
1. Corridor-wide Performance Assessment Reliability (Travel Time Variability)
1. Corridor-wide Performance Assessment WESTBOUND I-210 SR134 I-605 SR57 SPEED (mph)
1. Corridor-wide Performance Assessment EASTBOUND I-210 SR57 I-605 10-MILE MAXIMUM QUEUE SR134 5-HOUR PERIOD SPEED (mph)
1. Corridor-wide Performance Assessment CHP Reported Incidents WB-210 11/16/06 2006 Total 7,244 total incidents (~30/day)
1. Corridor-wide Performance Assessment CHP Reported Incidents EB-210 11/16/06 2006 Total 7,258 total Incidents (~30/day)
2. Bottleneck Identification WESTBOUND I-210 SR134 Hill Altadena Baldwin Santa Anita I-605 Azusa SR57 SPEED (mph)
2. Bottleneck Identification WESTBOUND I-210 Rte66/Foothill SR57 Azusa I-605 Mountain SR134 SPEED (mph)
3.-4. Base and Future Model Microscopic simulation: • a software tool to model traffic system, including roads, drivers, and vehicles, in fine details. Micro-simulation models • PARAMICS, VISSIM, AIMSUN2, CORSIM, MITSIM … Micro-simulation applications • Evaluate traffic flow and performance improvements for multiple investment types, including expansion, operational improvements, and ITS • Develop and evaluate new traffic models, algorithms, control strategies I-5 Orange County I-405 Network
5. Improvement Scenarios Existing Bottlenecks and Potential Solutions
5. Improvement Scenarios Existing Projects
6. Recommendations Short to Medium Range • Transportation Management Systems • Intelligent Transportation Systems • Transit Systems • Operational Improvements (aux lanes, ramps) • Maintenance (pavement) • Arterials Long Range • Operational Improvements • Capital Improvements (interchanges) • Expansion (freeway, transit, arterials)
Example of Recommended Improvements Transportation Management System • Widen ramps (increase storage) • Convert HOV bypass lanes to metered lanes • Connector metering (reduce demand) • Central control adaptive ramp metering (SWARM) Operational Improvements • Auxiliary lanes • Minor geometric modifications • Interchange modifications • Arterial connections/transitions
Example of Recommended Improvements Freeway to Freeway Connector Ramp Metering NB-57 to WB-210 Connector Ramp
Example of Recommended Improvements Freeway to Freeway Connector Ramp Metering EB-105 to NB-605 Connector Ramp (Metered) 2300 vph Mainline Speed 70 mph 720 vph 20 mph Ramp Flow
Example of Recommended Improvements Central Control Adaptive Ramp Metering (SWARM)
Example of Recommended Improvements Central Control Adaptive Ramp Metering (SWARM) • 2001 initial application test • Speed improvements (10 to 20% in peak hour) • Travel time improvements (15% in peak hour) • Mainline flow increase (5% in peak hour) • Ramp flow decrease (5%) • Ramp queue increase (20%) • 2007/2008 application test • Widen ramp storage • Queue detection control (queue does not exceed ramp) • Fwy to fwy connector metering control • Rates based on downstream bottlenecks
So What? WB-210 @Huntington Speed Flow Productivity drops by 30% when speeds drop below 30 mph (1 lane equivalent). Productivity picks up when speeds are above 40 mph. 2000 more cars on the freeway will mean 2000 less on arterials (Foothill/Huntington Blvd)
PROJECT DISCUSSION • 2006 Baseline Year • Open to I-215 since July 2007 • Current connector metering project construction 2008 • Good freeway historical data to 2001 • Micro-simulation Model • VISSIM Model • e/o SR-57 to w/o SR-134 only • Westbound AM only; Eastbound PM only • Data needs and collection • Budget and schedule constraints • Freeway simulation only
STAKEHOLDERS Stakeholders Role • Local issues and concerns • Relevant existing studies to consider • Simulation modeling input • Data resources • Review results How • Follow-up workshops
Contact info:Philip Law, SCAG – law@scag.ca.gov, 213-236-1841Elhami Nasr, Caltrans – elhami_nasr@dot.ca.gov, 213-897-0227Tom Choe, SMG – tom_choe@sysmetgroup.com, 213-382-6875