Download
1 / 35
350 likes | 510 Views
Loeblein clicker questions for Skate Park activities 1-4. I have written a series of activities and here are the learning goals for all four. Each activity can be downloaded from the Teaching Ideas section of the PhET website. Activity 1: Introduction to Conservation of Mechanical Energy

E N D
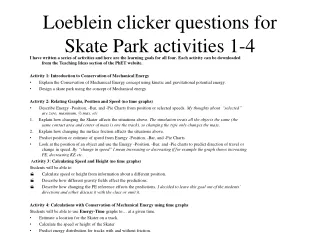
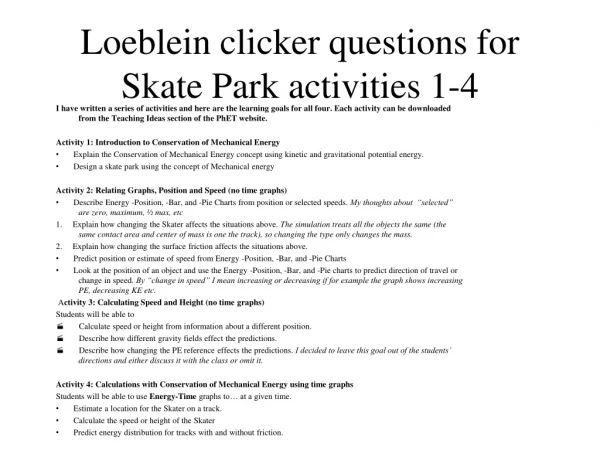
Loeblein clicker questions for Skate Park activities 1-4 I have written a series of activities and here are the learning goals for all four. Each activity can be downloaded from the Teaching Ideas section of the PhET website. Activity 1: Introduction to Conservation of Mechanical Energy • Explain the Conservation of Mechanical Energy concept using kinetic and gravitational potential energy. • Design a skate park using the concept of Mechanical energy Activity 2: Relating Graphs, Position and Speed (no time graphs) • Describe Energy -Position, -Bar, and -Pie Charts from position or selected speeds. My thoughts about “selected” are zero, maximum, ½ max, etc 1. Explain how changing the Skater affects the situations above. The simulation treats all the objects the same (the same contact area and center of mass is one the track), so changing the type only changes the mass. 2. Explain how changing the surface friction affects the situations above. • Predict position or estimate of speed from Energy -Position, -Bar, and -Pie Charts • Look at the position of an object and use the Energy -Position, -Bar, and -Pie charts to predict direction of travel or change in speed. By “change in speed” I mean increasing or decreasing if for example the graph shows increasing PE, decreasing KE etc. Activity 3: Calculating Speed and Height (no time graphs) Students will be able to · Calculate speed or height from information about a different position. · Describe how different gravity fields effect the predictions. · Describe how changing the PE reference effects the predictions. I decided to leave this goal out of the students’ directions and either discuss it with the class or omit it. Activity 4: Calculations with Conservation of Mechanical Energy using time graphs Students will be able to use Energy-Time graphs to… at a given time. • Estimate a location for the Skater on a track. • Calculate the speed or height of the Skater • Predict energy distribution for tracks with and without friction.
1. Do you think the Skater will make it over the first hump?(No friction on the track) • No, because his potential energy will be converted to thermal energy • No, because he doesn’t have enough potential energy • Yes, because all of his potential energy will be converted to kinetic energy • Yes, because some of his energy will be potential and some kinetic
2. Do you think the Skater will make it over the first hump?(lots oftrackfriction) • No, because his potential energy will be converted to thermal energy • No, because he doesn’t have enough potential energy • Yes, because all of his potential energy will be converted to kinetic energy • Yes, because some of his energy will be potential and some kinetic
3. Do you think the Skater will make it over the first hump?(No friction on the track) • No, because his potential energy will be converted to thermal energy • No, because he doesn’t have enough potential energy • Yes, because all of his potential energy will be converted to kinetic energy • Yes, because some of his energy will be potential and some kinetic
4. Do you think the Skater will make it over the first hump?(lots oftrackfriction) • No, because his potential energy will be converted to thermal energy • Yes, if not too much energy is converted to thermal • Yes, because all of his potential energy will be converted to kinetic energy • Yes, because some of his energy will be potential and some kinetic
5. In the next moment, the KE piece of the pie gets larger, then • The Skater is going up hill (left) • The Skater is going down hill (right) • There is no way to tell
6. In the next moment, the KE piece of the pie gets larger, then • The PE part stays the same • The PE part gets larger too • The PE part gets smaller • There is no way to tell
7. In the next moment, the KE piece of the pie gets larger, then • The Skater will be going faster • The Skater will be going slower • There is no way to tell
A B C D E 1. The dotted line on the chart shows the energy of the Skater, where could she be on the track?
A B C D E 2. The bar graph shows the energy of the Skater, where could she be on the track?
A B C D E 3. The pie graph shows the energy of the Skater, where could she be on the track? KE PE
PE KE A. B. C. D. 1 3 4 2 4. If the ball is at point 4, which chart could represent the ball’s energy?
1 3 4 2 5. If a heavier ball is at point 4, how would the pie chart change? KE • No changes • The pie would be larger • The PE part would be larger • The KE part would be larger PE
At 4 Next step 1 3 4 2 6. As the ball rolls from point 4, the KE bar gets taller. Which way is the ball rolling? • Up • Down • not enough info
7. The Energy chart of a boy skating looks like this How would you describe his speed? • He is at his maximum speed • He is stopped • He is going his average speed • He is going slow • He is going fast
8. The Energy chart of a boy skating looks like this How would you describe his speed? • He is at his maximum speed • He is stopped • He is going his average speed • He is going slow • He is going fast
C B A 9. Select a letter for each: stopped, slow and fast
Energy vs Position 10. Sketch this energy position graph. Label where the 5 spots, A-E, could be PE KE • He is going his maximum speed • He is stopped • He is going his average speed • He is going slow • He is going fast
Pendulum height 1. How high will pendulum rise? A) Less than h B) h C) More than h h Reference level (h = 0)
2. A 5000 kg coaster is released 20 meters above the ground on a frictionless track. What is the approximate speed at ground level? (point A) Velocity from PE • 7 m/s • 10 m/s • 14 m/s • 20 m/s • none of the above
3. What is its approximate speed at 10 meters high (point B )? A)7 m/s B)10 m/s C)14 m/s D)20 m/s E)none of the above
4. How fast would the coaster have to be going at the start to reach 21 meters high (point C)? • A)1.1 m/s • B) 3.2 m/s • C) 4.5 m/s • D) 20 m/s
Pendulum speed 5. Calculate velocity at B if h = 0.45 m, g = 10 m/s2 A) 3 m/s B) 4.5 m/s C) 7.5 m/s D) 9 m/s A h B Reference level (h = 0)
CQ1 PE to KE from Dubson/Tanner 6. A block initially at rest is allowed to slide down a frictionless ramp and attains a speed v at the bottom. To achieve a speed 2v at the bottom, how many times higher must the new ramp be? A) B) 2 C) 3 D) 4 E) none of these. v
6. A block initially at rest is allowed to slide down a frictionless ramp and attains a speed v at the bottom. To achieve a speed 2v at the bottom, how many times higher must the new ramp be? A) B) 2 C) 3 D) 4 E) none of these. CQ 6 Show work mghtop + 0KE + 0work = 0PEg +1/2 mvbottom2 First ramp:htop vbottom2 2nd ramp: h'top (2vbottom)2 = 4 (vbottom2) h'top = 4htop
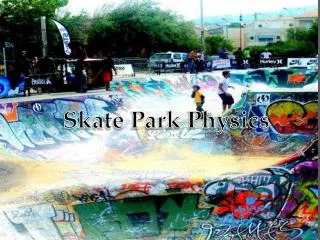
Energy Skate Park 4 Learning Goals: Students will be able to use Energy-Time graphs to… at a given time. •Estimate a location for the Skater on a track. Calculate the speed or height of the Skater Friction and frictionless. Predict energy distribution for tracks with and without friction. By Trish Loeblein updated July 2008 The Friction concepts are not addressed in these clicker questions. Some screen images are included, but it would be better to have the sim running. I have used tracks that are the default or under Track menu for easy reproduction.
1. What will the speed of the 75kg Skater be at 2 seconds? Total =2918 J KE=509 J PE=2408 J PE = 0 at dotted line A. 14m/s B. 8.8m/s C. 8.0m/s D. 3.7m/s
Comments for question 1: This is the default track with the PE line moved up to the track 14 is no sqrt 8 uses PE 8.8 uses Total E KE= 1/2mv2 509=1/2*75* v2
2. At what height is the 60kg Skater at 2 seconds? Total =3829 J KE=2429 J PE=1365 J A. 6.5m B. 4.2m C. 2.3m D. 1.9m
Comments for question 2: I used the Double well roller coaster track with the Skater changed to the girl and I moved the PE line to the bottom of the first well. Then I started from the “Return Skater” position.Comments about #3. I would show the slide, have the students make a drawing and then show the options on the next slide. 6.5 uses Total E, 4.2 uses KE, 1.9 uses mass of 75,
3. Draw what you think the energy graph look like at 10 seconds.
A B C 3. The energy graph at 10 s: 10
Comments and answer to 3: I used the double well roller coaster again with a ball at 18 kg for #3 and #4
4. What might the ball be doing at 5 seconds? • Going left to right at the lower dip • Going right to left at the lower dip • Going left to right at the higher dip • Going right to left at the higher dip PE KE