Download
1 / 17
180 likes | 376 Views
Customer Churn Segmentation Behaviors, Traits, and Attitudes A Case Study. Morgan Analytics Inc. 5731 Remington Park Drive Dallas, Texas 75252 Mobile – 214 300 9300 mike.morgan@morgananalytics.com www.morgananalytics.com. Objectives.

E N D
Customer Churn SegmentationBehaviors, Traits, and Attitudes A Case Study Morgan Analytics Inc. 5731 Remington Park Drive Dallas, Texas 75252 Mobile – 214 300 9300 mike.morgan@morgananalytics.com www.morgananalytics.com
Objectives • The client needed clear and actionable areas in which to focus its customer retention, win-back, customer service, and satisfaction efforts. • The client’s previous predictive churn models had not provided sufficient accuracy and actionability*. • The current research study was designed to • Identify and quantify the impact – on customer satisfaction, loyalty and churn – for: • Customer contact points. • Programs to reduce costly customer churn. • Efforts to foster links between satisfaction and customer loyalty or tenure. • Provide a model that can • Predict future churn in a profitable way. • Arm Customer Service with insights into customer churn. • Aid in the design and implementation of retention marketing programs.
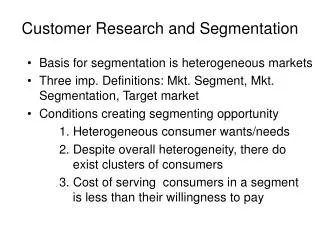
Methodology Overview • Customer database variables were used to guide the segmentation process. These related to client product usage levels, regions and retail locations, history of credit problems, and marketing program sources. • In addition, a primary research study was conducted via phone interviews, with 600 current and 590 previous customers, a total of 1,190 completed interviews, during December 2004 and January-February, 2005. • Customer/ex-customer status reported by respondents was required to match the customer database. • There were only small differences between customers and ex-customers in terms of household demographics. • 50% of the client’s retail locations served 92% of all respondents. • Respondents were asked for satisfaction ratings, reports of issues and incidents (positive and negative), attribute and image ratings, measures of shopping effort and intensity, and household demographics.
Methodology Overview (cont.) • Customers who churn appear to have multiple issues and motivations, including their propensity to shop around for alternatives, different product usage levels, and positive or negative customer service experiences. • The client needs to identify what drives churn and what churn segments, if any, have distinctly different churn drivers and profiles. • In the current study, churned customers are closely compared to current customers in order to uncover what sets them apart and how churn propensities should be addressed.
Analytic Model to Explain and Predict Churn • A latent class regression model was used to pinpoint factors related to customer churn. Variables in the customer database. Quantifying and predicting churn outcomes. Attitudinal churn drivers.
Major Findings – Churn Segments • Three segments emerged from the latent class regression model. • Losts • Loyals • At-Risks • Each of these has different • Proportions of current customers • Churn drivers and potential strategies • Customer Profiles • Some churn drivers are also shared across segments
Major Findings – Churn Segments • Segment differences help highlight the impact of Customer Service on • Whether the customer will be satisfied with the way their customer service and technical support are handled. • Customer perceptions on key attribute and image dimensions.
Major Findings – Churn Segments • An unexpected but informative result: • It appears unlikely that overall perceptions of the client’s performance or customer satisfaction depend heavily on any single transaction or event, whether positive or negative. • Instead, customer loyalty and churn depend on a several factors, including • The customer relationship over time and the types of issues and problems the customer encounters. • The characteristics of the customer and the household.
Major Findings – Churn Segments • Targeting the At-Risk segment emerges as a high priority for the client. • At-Risks appear to be more financially valuable than Loyals and Losts, with 24 more months of average tenure and half as many collection problems, compared to Loyals. • But they are also more prone to churn – they are 14% less likely to repurchase if an opportunity arose, compared to Loyal customers (76% versus 88% top-2-box rating on re-opens). • Unlike Loyals and Losts, overall satisfaction is NOT a clear driver of churn among At-Risks, based on the churn model. Instead, specific situations and problems have greater impact. • Losts are less valuable to retain as customers. • They include more write-offs and credit problems, less revenue, and other negative traits when compared to the other two segments.
Major Findings – Churn Segments • All-important lifestage dimensions are significantly different among churn segments. • Losts tend to be younger households, with significantly more adults under age 44, larger households and more kids. • At-Risks are older households, with significantly more adults over 65, smaller households and no kids. • Loyals tend to fall in-between these two. • Losts, Loyals and At-Risks differ from one another in terms of the retail locations they use and other customer database variables, making them easier to target through marketing.
Predicting Churn – Overview • Key properties of the segments were identified and developed in the churn model. • These properties were then used, in a statistical program called CHAID, to back-predict customer status codes for a recent random sample from the customer database. Households in the test sample • Did not participate in and were not contacted for participation in the current survey. • Were not used as input data to calibrate the churn model. • Are referred to in the current study as the holdout sample. • Customer codes included • Active – current customer • Closed – ex-customer who closed their account • Write-Off – customer involuntarily released for financial reasons. • (Other status codes were very infrequent, so no customers with those codes were used in the holdout sample.)
Predicting Churn – Results • The model produced an excellent hit rate. It correctly identified 91% of ex-customers and 70% of current customers, for an overall average of 78%.
Profiles of Predicted Segments • The predicted records in the holdout sample were then profiled. • The profiles of the predicted segments closely matched the study data. • This suggests that the model can be applied to the customer database as a whole, with robust and profitable results.
Loyals. This segment responds more to overall satisfaction than to specific issues and incidents. They are very unlikely to shop around compared to Losts and At-Risks. • Recommendations • Closer relationship marketing to Loyals is recommended. • World-class examples include Porsche’s periodic customer mailings and Ritz-Carlton’s frequent guest program. • Such programs can be developed and tested for the client’s larger and more established retail offices, since these are where Loyals have tended to open their accounts. • The client should ease credit-handling tactics for this segment. • Although rare, when Loyals do churn, important client-controllable variables are credit handling and the number of collection letters. • Using different long-term collection strategies will help avoid unnecessary terminations and foster longer tenure among Loyals. Recommendations
At-Risks. Although not primarily driven by overall satisfaction, this segment • Tends to be much more intolerant of difficulties in using the service, billing errors, and slow responses by Customer Service. • Unlike Loyals, but similar to Losts, they churn significantly more often when they perceive that their payment terms are unfavorable or not competitive. • Is the most likely segment to have churned when the family structure or residence changes and, unlike Loyals, they tend not to re-open. • Recommendations are • To reinforce the attractiveness of their deal – address the deal rather than overall satisfaction. • Offer future fee reductions with longer tenure and other loyalty-driven offers. • Offer to meet any competitive offer during the first year of the account. • Channel offers to smaller retail locations, since most At-Risks belong to these. • Target move and loyalty offers proactively to this segment • Retention-oriented direct mail and other advertising (“Glad You’re With Us”). • Offers and MarCom can be targeted through the smaller retail locations. Recommendations
Losts. Many, if not most of these households may not have been meant to be customers to begin with. • Like the At-Risks, Losts churn more often than Loyals when they perceive that their payment terms are unfavorable or not competitive. • While they do pay higher monthly fees, Losts tend to have lower customer value because of collection problems and higher churn rates. • Losts tend to perceive a lack of value on several key dimensions. • They are more likely to have been sold through TV offers rather than calling on their own initiative. • Unless they are destined to become Write-Offs, these customers will use more Customer Service resources – but less often call for Technical Support – than the other segments. • This is another signal that they have problems with the deal, not the service. • Recommendations • Monitor the ratio of Customer Service to Technical Support contacts. • Lack of calls to Technical Support characterizes the Losts, so offering this in advance may help retain some as paying customers. • De-prioritize for loyalty offers. (Naturally, caution must be exercised in implementing this type of strategy.) Recommendations