WBC Differential After LPS
170 likes | 335 Views
Neutros. WBC Differential After LPS. Figure 1. Neutros. Neutros. Neutros. Neutros. Table 1. Leukocyte enrichment as assessed by flow cytometry.

WBC Differential After LPS
E N D
Presentation Transcript
Neutros WBC Differential After LPS Figure 1 Neutros Neutros Neutros Neutros
Table 1. Leukocyte enrichment as assessed by flow cytometry. 1Data represent the Mean ±SEM; 2percent side scatter low, CD2 high; 3percent side scatter intermediate, CD33 high; 4quantity not sufficient for microarray analysis due to monocytopenia (see Table 1); 5percent side scatter high, CD66b high
Figure 2 Hierarchical Cluster Analysis
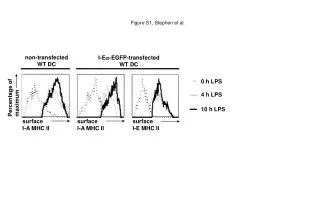
MHC Class II six hrs post endotoxin Figure 3 Neutrophils Monocytes T-cells
Probe Set Numbers at FDR = 0.1% Table 2 Leukocytes (previous study) 5,093 Leukocytes 8,358 Neutrophils 2,531 Monocytes 1,095 T-cells 456
Figure 4b Monocytes Figure 4c ?? Figure 4a Neutrophils
Figure 5a Neutrophils, 6 hrs
Figure 5b Monocytes, 6 hrs
Figure 5c T-cells, 6 hrs
Figure 6a Neutrophils, 6 hrs
Figure 6b Monocytes, 6 hrs
Figure 6c T-cells, 6 hrs
Neutrophils Figure 7a
Figure 7b Monocytes
Figure 7c T-cells
Table 3 Fold Up/Fold Down for p53 regulators
Figure 8 RPL/RPS Monocytes Neutrophils T cells