Download
1 / 17
170 likes | 276 Views
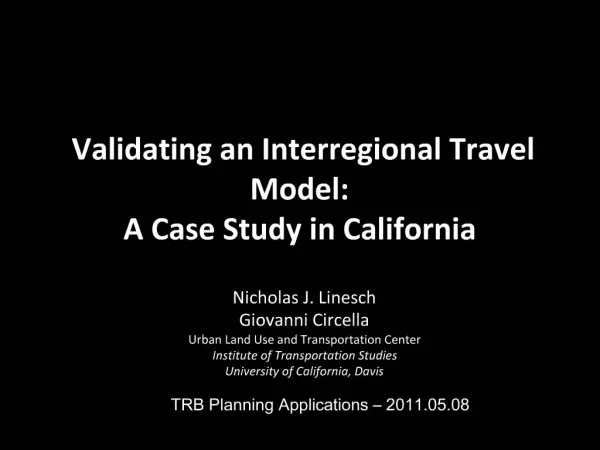
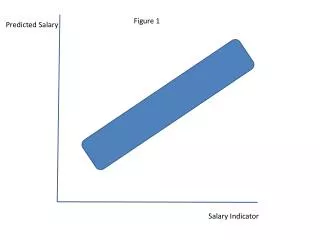
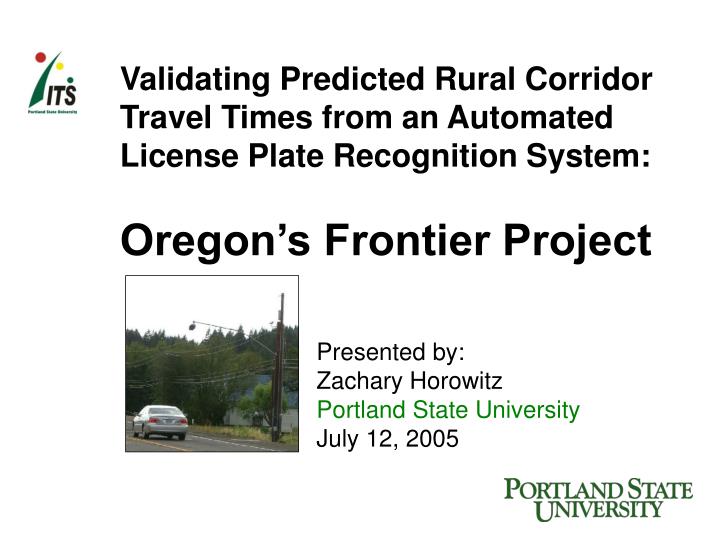
Validating Predicted Rural Corridor Travel Times from an Automated License Plate Recognition System: Oregon’s Frontier Project. Presented by: Zachary Horowitz Portland State University July 12, 2005. Presentation Outline. Introduction and Research Objective Study Corridor

E N D
Validating Predicted Rural Corridor Travel Times from an Automated License Plate Recognition System: Oregon’s Frontier Project Presented by: Zachary Horowitz Portland State University July 12, 2005
Presentation Outline • Introduction and Research Objective • Study Corridor • Frontier Time Travel System • Data • Analysis • Results and Conclusions
Frontier Time Travel Project • California – Oregon Advanced Transportation System (COATS) • ITS Technology deployed in rural settings • Pooled Fund Study in eight western states
Research Objective A field evaluation of a corridor time travel prediction system using license plate recognition software
Study Area – Camera Locations 22.25 mi 3.15 mi • 6 Cameras/3 Sites (1 per direction) • US 101 north of Lincoln City • OR-18 near Otis • OR-18 near Grand Ronde
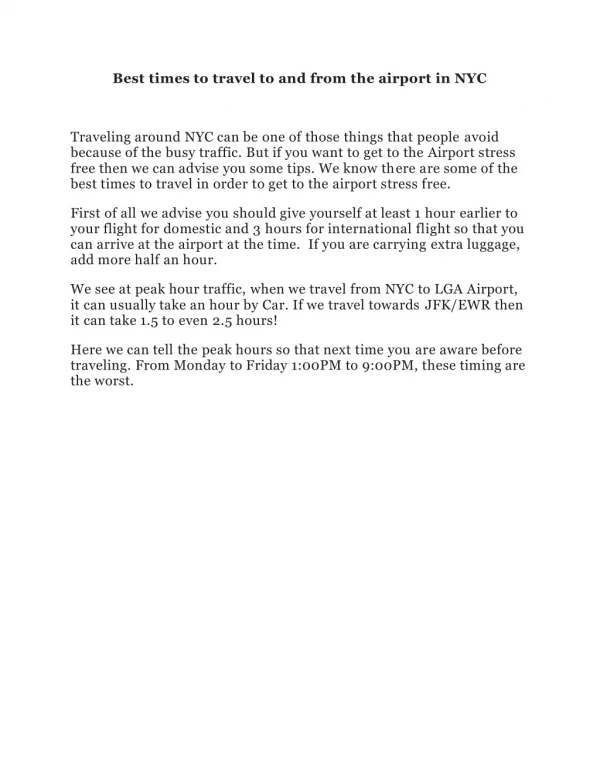
Study Area – OR-18 Details • 25 mile rural route between Portland and Oregon coast • Primarily 2-lane highway with passing lanes • Carries heavy weekend, recreational travel • Major truck route to coast • Known to be congested during weekends/holidays and summer • Average daily traffic (ADT): • East of Grand Ronde: 20,000 • West of Grand Ronde: 10,000 • No traffic signals • Directional interchange at US 101 http://www.epinions.com/park-Parks-All-OR-HB_Van_Duzer_Forest_State_Scenic_Corridor
Frontier Travel Time System Cameras, license plate Reader, software Communication Travel time calculation software / processing ITS technologies such as VMS, Tripcheck
Experiment Almanac Sunday, July 13, 2003 and Friday, July 2, 2004 Higher volume, summer, weekend, holiday Sample sizes of probe vehicles: 6, 7 Route: (Lincoln City to Valley Junction to L. City) 2 10 minute headways with SOP instructions
Day 1 – Sunday, July 13, 2003 Palm OS with GPS, running ITS-GPS: 4 veh. Windows laptop PC’s, running CoPilot: 2 veh. Day 2 – Friday, July 2, 2004 Palm OS with GPS, running ITS-GPS: 5 veh. Windows laptop PC’s, running CoPilot: 2 veh.
x t Data Collected Date, time, speed at 3 sec. intervals, latitude, longitude, distance and time between readings Trajectories plotted on a time space diagram (x,t) Spherical geometry used to calculate distance between points ODOT data for study days: Date, time, site ID, link ID, # of matched plates, average travel time between sites
Data Difficulties GPS fixes lost – 3 sec re-establishment times Error distribution: Interpolated distance = Distance between readings (25.4 / Total distance measured by GPS unit)
Statistical Analysis α = .05, 95% confidence interval
Errors Differences between times predicted with the Frontier system and the probe vehicles Segment 1 Segment 2 Short segments revealed over-prediction by Frontier Long segments revealed under-prediction by Frontier
Results and Conclusions • Based on the data, the Frontier Travel Time system located on Oregon-18 predicts travel times effectively. • Travel times are accurately predicted within 1 minute. • Travel times could be displayed upstream of corridor using VMS located at key junctions. • Additional tests would help to improve data. • Data latency and hardware reliability were issues.
Acknowledgements • Robert Fynn, ODOT • FHWA and the WTI at Montana State University • Steve Albert and Patrick Wright, WTI • Annette Clothier and Galen McGill, ODOT • Tarek Abou El-Seoud • “Probe” vehicle drivers • Dr. Robert Bertini, PSU • Dr. Chris Monsere, PSU • Matt Lasky, PSU • www.its.pdx.edu