Download

1 / 28
280 likes | 367 Views
This project aims to analyze travel times in cities like NYC and Boulder to encourage the use of alternate transportation methods. By utilizing GIS data preprocessing and simulations, the efficiency of public transit and walking routes in terms of time is evaluated. The project includes extracting paths from General Transit Feed Specification (GTFS) and Open Street Map (OSM) data, rasterizing vector paths, skeletonizing, and transforming distance data. By converting road distances into factors of friction, the simulation calculates the fastest paths considering walking speed and public transit costs. Various scales of preprocessing like micro and macro smoothstep methods are implemented. The project explores the difference between hexagon and square grids in terms of cost computation and visualization. The goal is to promote sustainable and time-efficient modes of urban transportation.

E N D
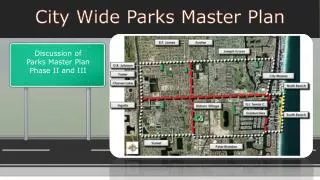
Mapping City Wide Travel Times Andrew Hardin
Project Goal • Encouraging alternate transportation • NYC- Bike Share • Boulder’s Transportation Management • Why? • Is using public transit and walking efficient? • in terms of time? intro \ demo \ gis side \ data \ preprocessing \ simulation \ conclusions
Go to http://Iskander/TravelTime/ intro \ demo \ gis side \ data \ preprocessing \ simulation \ conclusions
GIS Side Data Preprocessing vs. Simulation web side network side intro \ demo \ gis side \ data \ preprocessing \ simulation \ conclusions
Data: GTFS • GTFS = “General Transit Feed Specification”. • Describes transit routes, stops, times, etc. • Google Maps Routing intro \ demo \ gis side \ data \ preprocessing \ simulation \ conclusions
Data: OSM • OSM = “Open Street Map”. • “Crowd Sourced”, open source map data. • Downloaded as plain text. intro \ demo \ gis side \ data \ preprocessing \ simulation \ conclusions
Why OSM? Source: Boulder County Source: OSM intro \ demo \ gis side \ data \ preprocessing \ simulation \ conclusions
Preprocessing OSM • Convert text to a raster grid that represents the friction of distance. • Theory: it’s easier to walk on / near streets. • Extract OSM paths. • Rasterize. • Skeletonize. • Transform with smoothstep intro \ demo \ gis side \ data \ preprocessing \ simulation \ conclusions
1. Extract Paths • OSM contains different types of paths. • Extract all the “highways”, including • Highways • Residential streets • Bike paths • Sidewalks • … intro \ demo \ gis side \ data \ preprocessing \ simulation \ conclusions
2. Rasterize • Convert the vector paths into a tessellation. intro \ demo \ gis side \ data \ preprocessing \ simulation \ conclusions
2. Rasterize • Convert the vector paths into a tessellation. * Brensenham’s Line Algorithm * intersects intro \ demo \ gis side \ data \ preprocessing \ simulation \ conclusions
3. Skeletonize • Goal: get distance (in tiles) from nearest path. • Also called “Medial Axis Transformation”. 0 0 0 0 0 0 0 0 0 0 0 0 0 0 0 0 0 0 0 0 0 0 1 1 1 1 1 0 0 1 1 1 1 1 0 0 1 1 1 1 1 0 0 1 2 2 2 1 0 0 1 2 2 2 1 0 0 1 1 1 1 1 0 0 1 2 3 2 1 0 0 1 2 2 2 1 0 0 1 1 1 1 1 0 0 1 2 2 2 1 0 0 1 2 2 2 1 0 0 1 1 1 1 1 0 0 1 1 1 1 1 0 0 1 1 1 1 1 0 0 1 1 1 1 1 0 0 0 0 0 0 0 0 0 0 0 0 0 0 0 0 0 0 0 0 0 0 Iterate: For each cell, set its value equal to the minimum of its neighbours + 1. Step 1: Fill raster 1s. Set roads to 0. intro \ demo \ gis side \ data \ preprocessing \ simulation \ conclusions
4. Transform w/ smoothstep • Goal: Convert distance from road (in tiles) to factors of friction. • It takes x times longer to cross this cell. 3 Friction smoothstep function 1 0 75 Distance from nearest path (m) intro \ demo \ gis side \ data \ preprocessing \ simulation \ conclusions
Preprocessing: Micro Scale Smoothstep OSM Paths Rasterize Skeletonize 1 0 10 3x intro \ demo \ gis side \ data \ preprocessing \ simulation \ conclusions
Preprocessing: Micro Scale Smoothstep OSM Paths Rasterize Skeletonize 1 0 10 3x intro \ demo \ gis side \ data \ preprocessing \ simulation \ conclusions
Preprocessing: Square (macro) Smoothstep OSM Paths Rasterize Skeletonize 1 3x intro \ demo \ gis side \ data \ preprocessing \ simulation \ conclusions
Preprocessing: Hexagon (macro) Smoothstep OSM Paths Rasterize Skeletonize 1 3x intro \ demo \ gis side \ data \ preprocessing \ simulation \ conclusions
Preprocessing: Hexagon (macro) Smoothstep OSM Paths Rasterize Skeletonize 1 3x intro \ demo \ gis side \ data \ preprocessing \ simulation \ conclusions
Simulation Parameters • City? (Boulder ,CO) • Where? (latitude, longitude) • When? (December 1, 2013 at 2:30 PM) • Grid Type? (square or hexagon) • Walking Speed? (3.1 m/s) intro \ demo \ gis side \ data \ preprocessing \ simulation \ conclusions
Simulation Steps • Construct a connected graph of nodes from our smoothstep grid.
Grid to Graph Node Smoothstep Link * Queen Contiguity intro \ demo \ gis side \ data \ preprocessing \ simulation \ conclusions
Grid to Graph (hex) Node Smoothstep Link intro \ demo \ gis side \ data \ preprocessing \ simulation \ conclusions
Simulation Steps 2. Given a starting node, walk across the graph finding the fastest path to each node. Weight or Cost Time = friction * walking speed
Friction Cost + Public Transit Constant Cost intro \ demo \ gis side \ data \ preprocessing \ simulation \ conclusions
Friction Cost + Public Transit Constant Cost intro \ demo \ gis side \ data \ preprocessing \ simulation \ conclusions
Hexagons Squares (Hexagons - Squares) • (Static Differences) intro \ demo \ gis side \ data \ preprocessing \ simulation \ conclusions
Hexagons vs. Squares • Computing Cost • Hexagons: 2.5 times longer • Visualization • Simulation Differences • Preprocessing • Contiguity intro \ demo \ gis side \ data \ preprocessing \ simulation \ conclusions
Wrap-up • Alternate forms of transportation • Is public transit and walking efficient? -in terms of time? intro \ demo \ gis side \ data \ preprocessing \ simulation \ conclusions