Download
1 / 27
270 likes | 380 Views
Town of Fairview Community Survey. RESEARCH AND TRAINING SPECIALISTS, INC Concord, North Carolina April 2011. Survey Method. 1195 surveys were randomly distributed to the community 480 were returned Results are accurate within 3%. Primary Findings.

E N D
Town of Fairview Community Survey • RESEARCH AND TRAINING SPECIALISTS, INC • Concord, North Carolina • April 2011
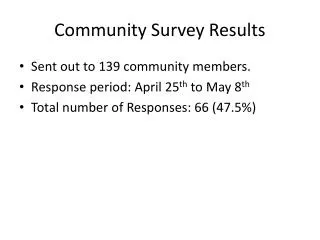
Survey Method • 1195 surveys were randomly distributed to the community • 480 were returned • Results are accurate within 3%.
Primary Findings • The primary reason residents choose to live in Fairview is for the rural, country lifestyle. • The community appears split on a number of issues • The division is often based on length of residence, age or gender.
Concerns by Gender • Keeping low tax rate • 71.3% of females are concerned; • 49.4% of males • However, female residents are also more likely to support a tax increase for: • an increase in Sheriff Patrols, • garbage collection and • recycling opportunities.
Concerns by Length of Residence • Rapid Growth: 88% of those living in Fairview more than eleven years are concerned about rapid growth; • 67.2% of those living here 6-10 years • Small Town Atmosphere: Over 90%of those living in Fairview more than eleven years are concerned about keeping the small town atmosphere – 85.1% 1-5 years; 57.1% < 1 yr.
Concerns by Length of Residence • Crime: Over 95% of those living in Fairview more than eleven years are concerned about crime; 87.2% 1-5 years • Town Spending: Those living in Fairview 11 or more years are the most concerned (P<.03) • 75% 1-5 years; 83.1% over 10 years
Safety and Law Enforcement • 97.7% of respondents indicate that the feel either very safe (65.5%) or somewhat safe (32.1%) • 81.5% do not feel the need for additional law enforcement service
Retail Service • Less than 50% want a major grocery or pharmacy chain in the town. • Major grocery chain 49.0% Yes 37.6% No 13.3% Not sure • A pharmacy Chain 43.1% Yes 41.4% No 15.5% Not sure
Opinions on Development • 78% of residents agree most residential development should be designated for lots larger than one acre • 91.2% of residents feel that Fairview should encourage continued agricultural activities • 66.7% are opposed to the clustering of homes • The community appears conflicted over the establishment of a traditional town center: • 35.7% agree with the concept; 37.4% oppose - 26.8% are neutral
Support for Services • Only two suggested Town financial commitments had more than 50% support: • 75% of residents support replacing outdated fire equipment • 53.8% support recycling opportunities • Only 15% support building a new Town Hall
Purchase of land for park • Overall – 38.5% support • Women are more likely to support the purchase of land for a park than are men (p<.003) • Younger residents (under age 35) are more likely than older residents to support the purchase of land
Building a new fire station • Overall 31.5% support • Women are more likely than men to support building a new fire station (p<.03) • Residents who are not retired are more likely to support building a new fire station (p<.003) • Residents who are ages 36 to 65 are most likely to support building a new fire station (p<.01) • Residents who have lived in town 10 years or less are more likely to want to build a new fire station (p<.001)
Replace outdated fire equipment • Residents who are retired are less likely to support replacing the fire equipment than are non-retired residents (p<.03) • Younger residents are more likely to support replacing the fire equipment (p<.01) • Newer residents are more supportive of replacing the fire equipment than are those who have lived in the town more than 10 years (p<.04)
Provide garbage/recycling • Females are also more likely to support garbage collection than male residents (p<.000) • Female residents are also more likely to support expanded recycling opportunities than male residents (p<.000)
Amount of Tax Increase Support • 75.7% of residents are willing to pay increased taxes to replace the outdated fire equipment. • 48.1% support a 1 cent increase while • 18.8% support 2 cents and • 8.8% support 3 a 3 cent increase.
Tax Increase • 77.5% of residents are opposed to any tax increase for a new town hall and • two-thirds (65.7%) oppose a tax increase to purchase land.
Gender and age are the most common factors that differentiate between those who are willing to pay and those who are not.
Differences in willingness to pay • Gender: Women are more willing than men to pay more taxes for the following: • create a park expand Sheriff’s Patrol • to have garbage collection and • to have recycling opportunities • Age: Residents under 50 are more willing • to purchase land and • create a park
Differences • Retired: Those who are not retired are more willing to build a new fire station • Length of Residence: Those who have lived in Fairview between 6 and 15 years most likely support an expanded Sheriff’s Patrol
Fee of Tax for Garbage Collection • The community is evenly split on the garbage collection fee-tax • 51% do not support garbage collection • Of the remaining 49%: • 10% prefer the tax, • 18.8% prefer the fee and • 20% would accept either
Thank You Paul C. Friday, Ph.D. rtsfriday@vnet.net