Download
1 / 26
260 likes | 347 Views
Explore the development and applications of Synthetic Aperture Radar (SAR) sensors in Southeast Asia, highlighting key missions, sensor basics, and market trends. Discover the value and opportunities offered by the next generation of SAR sensors.

E N D
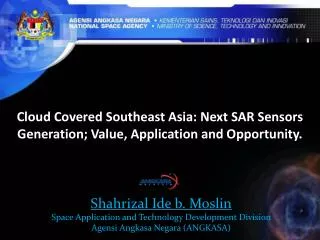
Cloud Covered Southeast Asia: Next SAR Sensors Generation; Value, Application and Opportunity. Shahrizal Ide b. Moslin Space Application and Technology Development Division Agensi Angkasa Negara (ANGKASA)
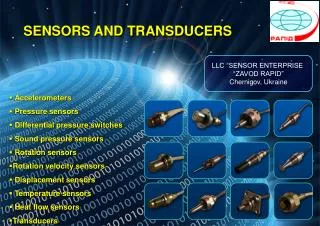
Worldwide Radar Mission Radar Mission • Synthetic Apature Radar: SEASAT, ERSI 1&2, ALMAZ, JERS1, SIRC/X-SAR, RADARSAT, MAGELLAN, ASAR, ENVISAT, ALOS, TERRASAR,COSMO, SARLupe, Sentinel 1.. • Scattterometers: SEASAT, ERS1, NSCAT, ASCAT, QUICKSAT • Altimeters: SEASAT, GEOSAT, ERS1&2, TOPEX, POSEIDON, Jason 1 – 3, SIRAL, Cyrosat, SRAL • Rain Radar: TRMM • Cloud Radar: CloudSat
Motivation behind SAR mission Civilian user point of view - Day and night capability - All weather capability - Penetration of EM waves - High resolution
RazakSat image statistics • Scene size : 20km X 20km • Analysis based on image scene received by GRS in Temerloh • Catalogue image is less than downloaded image is due to IRPS system is not operational to generate catalogue from 26 Oct until 30 Nov 2009. Total image is expected to be within 824 ~ 1300. 11
RazakSat image statistics • Obervations on Malaysia = 300 Scene
RazakSat image Bukit Jalil Singapore KLIA Sepang
Problems of using EO data in Malaysia Laporan Kajiselidik Keperluan Pengguna Data Satelit Remote Sensing Di Malaysia 2011, Agensi Remote Sensing Malaysia
Preference of satellite data of Malaysians Laporan Kajiselidik Keperluan Pengguna Data Satelit Remote Sensing Di Malaysia 2011, Agensi Remote Sensing Malaysia
Application trend for EO users in Malaysia Laporan Kajiselidik Keperluan Pengguna Data Satelit Remote Sensing Di Malaysia 2011, Agensi Remote Sensing Malaysia
The Next Space-based SAR Sensors Generation L-band SAR JAXA : ALOS-2, L-band SAR sensor allowing to get a resolution of 1 m using Spotlight mode INPE (Brazilian National Institute for Space and Research) is proposing an L-band SAR on the SSR-2 Mission with 3 m resolution and 20 km swath. The Argentinian National Space Activities Commission (CONAE) is developing the SAOCOM X-band SAR ASI (Italy) : COSMO-SkyMed Second Generation using X-band SAR (resolution <1m) Spain : SAR satellite called Paz. The Paz SAR instrument; less than 1 m resolution. The Russian : Advance SAR. The Advance SAR instrument will be embarked on board of the Meteor-MP-N1 Mission of ROSKOSMOS (the Russian Federal Space Agency). The Korea Aerospace Research Institute (KARI): KOMPSAT-5 Mission (1 meter) ISRO (Indian Space Research Organization) is proposing a C/X SAR instrument on DMSAR Mission. C-band SAR ESA: the Sentinel-1 programme (5 meter resolution) Canada is developing the RADARSAT Constellation Mission (RCM) composed of 3 satellites using a SAR instrument operating in C-band
Global EO Market • Northern Sky Research (NSR) forecasts, the Global EO market will grow at an average rate of 6.9% a year, and is expected to nearly double from a $3.4B industry in 2009 to a $6.2B industry in 2018
Market drivers for EO • Availability of EO Data: The number of EO (passive and active)satellites over the past decade has increased significantly. • Affordability of EO data: The cost of remote sensing satellites has dramatically decreased in the past few years • Government Demand for EO data: Government demands for societal applications of Earth Observation products and services are best met through satellite imagery. • Commercial Demand for location based information services: the synergy that has been achieved through the combination of satellite imagery, mobile telecommunications, navigation information and software processing. Virtual globes (ie Google Earth, Microsoft Live Earth, etc.) • Political and Social Factors: Strong political will and bold decisions have been taken by policy makers to relax the regulatory environment for EO data images.
EO trends in the future • Technology: With the emergence of smaller and less expensive satellites. • Value Added Service: The growing trend of seamless integration of EO imagery with GIS, navigation and other telecommunication technology has enhanced the ubiquity of imagery data. • Availability: Wide availability of free data, products and services provided by government satellites and enterprises such as Google, has increased the use of EO data by the general public. • Regulation: Export control issues (ITAR) have had a negative impact on the market, but they have also helped to expand the market place. • Market Players: As the number of players in the EO industry grows, it is expected that competitiveness will result in the emergence of many new applications. • Evolving Investment Strategies: Governments are moving away from the business model of investing directly in EO data collection assets, and instead, are now providing incentives to encourage commercial enterprises to invest in the EO infrastructure. • Commercialisation of the EO Industry: Government agencies, the primary investors and operators of EO satellite systems, are increasingly turning to commercial companies to develop and operate EO data systems
Guideline for “future mission”(if it is decided to build a combined sensor )
Concluding Remarks By looking at the optical applications and emerging SAR applications, it becomes clear that both technologies are complementary, and there an interest for end users have access to the imagery products generated by both instruments. Some applications such as disaster management, flooded areas, bare soil, droughts, ocean and ice surface, detection of changes in infrastructure and vegetation can be brilliantly satisfied using SAR data and they have to be promoted in such a way to be easily understood by a large user community. Integration of the images is the best answer for the society to have an updated EO images for their applications. Integration done either during processing the image on ground or integration of sensor on the spacecraft.
Thank You ! Shahrizal Ide b. Moslin Space Application and Technology Development Division Agensi Angkasa Negara (ANGKASA)