Download
1 / 69
721 likes | 886 Views
Learn about the Atomization Method, Atomic Energy Level Diagrams, Spin-Orbital Interactions, and more in atomic spectroscopy. Understand atomic emission and absorption spectra and atomic line broadening concepts.

E N D
Introduction to Atomic Spectroscopy Lecture 10 1
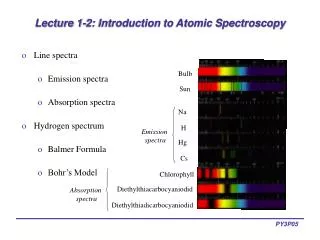
An Introduction to Optical Atomic Spectroscopy The prerequisite for performing atomic spectroscopy is the: Atomization Method 1- Compounds are first converted to gaseous molecules. 2- Gas molecules then converted to gaseous atoms. 3- Gaseous atoms absorb energy from a beam of radiation or simply heat. Measuring the absorption: (needs external light source). Measuring the emission: resulted from excited atoms (don’t need external light source). Both Abs. and Em. Is related to concentration of analyte. 4
Atomic Energy Level Diagrams Only valence electrons are responsible for atomic spectra observed in a process of absorption or emission of radiation in the UV-Vis region. Valence electrons in their ground states are assumed to have an energy equal to zero eV. As an electron is excited to a higher energy level, it will absorb energy exactly equal to the energy difference between the two states. 5
Portion of the sodium energy level diagram where sodium got one electron in the 3s orbital: (3 S1 Val. El.) 6
more intense than others (most prop. And dense, (resonance lines (preferred for measurements) 7
- The dark lines represent most probable transitions and in an atomic spectrum they would appear more intense than others. - Two transitions, of very comparable energies (589.0 and 589.6 nm), from the 3s ground state to 3p excited state do take place. - This suggests splitting of the p orbital into two levels that slightly differ in energy. Explanation: Splitting may be presented as a result of electron spin where the electron spin is either in the direction of the orbital motion or opposed to it. 8
Both spin and orbital motion create magnetic fields that may lead to: Lower E line: interact in an attractive manner, if motion is in opposite direction, lower energy. Higher E line: interact in a repulsive manner when both spin and orbital motion are in the same direction. The same occurs for both d and f orbitals but the energy difference is so small to be observed. A Mg+ ion would show very similar atomic spectrum as Na since both have one electron in the 3s orbital. 9
For atoms of large numbers of electrons: Atomic spectra become too complicated and difficult to interpret. This is mainly due to presence of a large numbers of closely spaced energy levels. Selection Rule: Transition from ground state to excited state is not arbitrary and unlimited. Transitions follow certain selection rules that make a specific transition allowed or forbidden. 10
Atomic Emission and Absorption Spectra At room temperature: All atoms are in the ground state. Excitation of electrons: From ground state atoms requires an input of sufficient energy to transfer the electron to one of the excited state through an allowed transition. Excited electrons: Spend a short time in the excited state (shorter than a ms). Relaxation an excited electron: Emit a photon and return to the ground state. 11
Each type of atoms would have certain preferred or most probable transitions (sodium has the 589.0 and the 589.6 nm). Relaxation would result in very intense lines for these preferred transitions where these lines are called resonance lines. Absorption of energy is most probable for the resonance lines of each element. Thus intense absorption lines for sodium will be observed at 589.0 and 589.6 nm. 12
Atomic Fluorescence Spectra When gaseous atoms at high temperatures are irradiated with a monochromatic beam of radiation of enough energy to cause electronic excitation: Emission takes place in all directions. The emitted radiation from the first excited electronic level, collected at 90o to the incident beam, is called resonance fluorescence. Photons of the same wavelength as the incident beam are emitted in resonance fluorescence. This topic will not be further explained in this text as the merits of the technique are not very clear compared to instrumental complexity involved 13
Atomic Line Width Should have infinitesimally small (or zero) line width since transition between two quantum states requires an exact amount of energy. However, careful examination of atomic lines reveals that they have finite width. For example, try to look at the situation where we expand the x-axis (wavelength axis) of the following line: 14
The effective line width in terms of wavelength units : Is equal to Dl1/2 Defined as the width of the line, in wavelength units, measured at one half maximum signal (P). The question which needs a definite answer is what causes the atomic line to become broad? 16
Reasons for Atomic Line Broadening There are four reasons for broadening observed in atomic lines. These include: The Uncertainty Principle t. E h For un. of E = zero t must be Nature places limits on the precision by which two interrelated physical quantities can be measured. Uncertainty present for calculation of the energy required for a transition when the lifetime of the excited state is short. Error in E leads to error in 17
DE>const/Dt DE = hc/Dl Const’/Dl > Dt Therefore, atomic lines should have some broadening due to uncertainty in the lifetime of the excited state. The broadening resulting from the uncertainty principle is referred to as natural line width and is unavoidable. 18
2. Doppler Broadening Atoms moving fast either toward or away the detector (transducer): Fast moving atom toward a transducer: More wave crests and thus higher frequency will be measured. Fast moving atom away from a transducer: Lest wave crests and thus lower frequency will be measured. The wavelength of radiation emitted by the two types are different. The same occurs for sound waves 19
Assume your ear is the transducer, when a car blows its horn toward your ear each successive wave crest is emitted from a closer distance to your ear since the car is moving towards you. Thus a high frequency will be detected. On the other hand, when the car passes you and blows its horn, each wave crest is emitted at a distance successively far away from you and your ear will definitely sense a lower frequency. 20
higher frequency detected Lower frequency detected 21
The line width (Dl) due to Doppler broadening can be calculated from the relation: Dl/lo = v/c Where: lo :is the wavelength at maximum power and is equal to (l1 + l2)/2, (resulted from an atom moving perpendicular to the transducer will keep its original frequency and will not add to line broadening by the Doppler effect) v : isthe velocity of the moving atom. c : is the speed of light. . 22
In the case of absorption lines, you may visualize the line broadening due to Doppler effect since fast atoms moving towards the source will experience more wave crests and thus will absorb higher frequencies. On the other hand, an atom moving away from the source will experience less wave crests and will thus absorb a lower frequency. The maximum Doppler shifts are observed for atoms of highest velocities moving in either direction toward or away from a transducer (emission) or a source (absorption). 23
3. Pressure Broadening (Collisional broadening) At high pressure atoms Line broadening caused by collisions of emitting or absorbing atoms with other atoms, ions, or other species in the gaseous matrix. These collisions result in small changes in ground state energy levels. Thus the energy required for transition to excited states will be different and dependent on the ground state energy level distribution. 25
Source for Fluorescence Spectroscopy 200 to 1100 nm 26
Pressure Broadening result in important line broadening. This phenomenon is most astonishing for xenon where a xenon arc lamp at a high pressure produces a continuum from 200 to 1100 nm instead of a line spectrum for atomic xenon. A high pressure mercury lamp also produces a continuum output. Both Doppler and pressure contribution to line broadening in atomic spectroscopy are far more important than broadening due to uncertainty principle. 27
4. Magnetic Effects Gaseous atoms in presence of a magnetic field: Splitting of the degenerate energy levels. The complicated magnetic fields exerted by electrons in the matrix atoms and other species will affect the energy levels of analyte atoms. The simplest situation: Is one where an energy level will be split into three levels 1)one of the same quantum energy. 2) Second one of higher quantum energy, 3)The third assumes a lower quantum energy state. A continuum of magnetic fields exists due to complex matrix components, and movement of species, thus exist. Electronic transitions from the thus split levels will result in line broadening. 28
The Effect of Temperature on Atomic Spectra Atomic spectroscopic methods require the conversion of atoms to the gaseous state. This requires the use of high temperatures (in the range from 2000-6000 oC). Thee high temperature can be provided through: A flame. Electrical heating. An arc or a plasma source. It is essential that the temperature should be : Of enough value to convert atoms of the different elements to gaseous atoms and, In some cases, provide energy required for excitation. Remain constant throughout the analysis especially in atomic emission spectroscopy. 30
Quantitative assessment: The effect of temperature on the number of atoms in the excited state can be derived from Boltzmann equation: Where: Nj: is the number of atoms in excited state No : is the number of atoms in the ground state, Pj and Po : are constants determined by the number of states having equal energy at each quantum level Ej: is the energy difference between excited and ground states. K : is the Boltzmann constant. T: is the absolute temperature. 31
Boltzmann distribution Nj /N0 at 3000 K Atom Wavelength Cs 852.1 nm 7.24 10-3 Na 589.0 nm 5.88 10-4 Ca 422.7 nm 3.69 10-5 Zn 213.9 nm 5.58 10-10 32
Application of Boltzmann equation: Let us consider the situation of sodium atoms in the 3s state (Po = 2) when excited to the 3p excited state (Pj = 6) at two different temperatures 2500 and 2510K. Now let us apply the equation to calculate the relative number of atoms in the ground and excited states: Usually we use the average of the emission lines from the 3p to 3s where we have two lines at 589.0 and 589.6 nm which is: 33
Therefore: At higher temperatures: The number of atoms in the excited state increases. Let us calculate the percent increase in the number of atoms in the excited state as a result of this increase in temperature of only 10 oC: 35
Introduction to Atomic Spectroscopy Lecture 11 37
Effect of Temperature on Atomic Absorption and Emission Which technique would be affected more as a result of fluctuations in temperature? The answer to this important question is rather simple. Atomic emission: It will be severely affected by fluctuations in temperature since signal is dependent on the number of atoms in the excited state. This number is significantly affected by fluctuations in temperature as seen from the example above. Atomic absorption: The signal depends on the number of atoms in ground state that will absorb energy. 38
very high as related to the number of excited atoms: Nj/No = 1.72x10⁻⁴ or 172 excited atoms for each 106 atoms in ground state. This suggests a very high population of the ground state even at high temperatures. Therefore: Atomic absorption will not be affected to any significant extent by fluctuations in temperature, if compared to atomic emission spectroscopy. 39
Some indirect effects of temperature on atomic absorption spectroscopy. Better sensitivities are obtained at higher temperatures since higher temperatures can increase the number of vaporized atoms at any time. Higher temperatures will increase the velocities of gaseous atoms, thus causing line broadening as a result of the Doppler and collisional effects. High temperatures increase the number of ionized analyteand thus decrease the number of atoms available for absorption (decrease of signal). 40
Band and Continuum Spectra Associated with Atomic Spectra When the atomization temperature is insufficient to cause atomization of all species in the sample matrix: Existent molecular entities, at the temperature of the analysis, impose very important problems on the results of atomic absorption and emission spectroscopy. The background band spectrum should be removed for reasonable determination of analytes. Otherwise, the sensitivity of the instrument will be significantly decreased. 41
As the signal for the blank is considered zero and thus the instrument is made to read zero, when the analyte is to be determined, it got to have an absorbance greater than the highest point on the continuum and the instrument will assume that the absorbance related to analyte is just the value exceeding the background blank value. This will severely limit the sensitivity of the technique. يجب التخلص من المنحنى بطريقة سليمة ستدرس لاحقا بتقنية Back ground by correction 43
Putting this conclusion in other words we may say that if the analyte signal is less than the background blank, the instrument will read it as zero. Therefore, it is very important to correct for the background or simply eliminate it through use of very high temperatures that will practically atomize all species in the matrix. We will come to background correction methods in the next chapter. 44
Atomization Methods It is essential, as we have seen from previous discussion, that all sample components (including analytes, additives, etc.) should be atomized. The atoms in the gaseous state absorb or emit radiation and can thus be determined. Many atomization methods are available which will be detailed in the next two chapters. 45
Generally, flame atomization methods can be summarized by: 46
Sample Introduction Methods The method of choice for a specific sample will mainly depend on: whether the sample is in solution or solid form. The method for sample introduction in atomic spectroscopy affects the precision, accuracy and detection limit of the analytical procedure. 47
Introduction of Solution Samples 1. Pneumatic هوائي Nebulizers : Samples in solution are usually easily introduced into the atomizer by a simple nebulization, aspiration, process. Nebulization: Converts the solution into an aerosol of very fine droplets using a jet of compressed gas. The flow of gas carries the aerosol droplets to the atomization chamber or region. Several versions of nebulizers are available and few are shown in the figure below: 48
Concentric Tube Nebulizer Predominates in most instruments 49
Also, predominates in most instruments Cross Flow Nebulizer 50