Download
1 / 37
370 likes | 390 Views
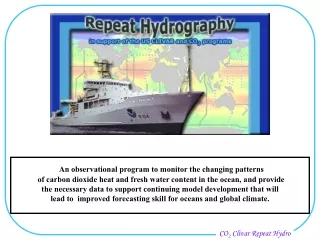
An observational program to monitor the changing patterns of carbon dioxide heat and fresh water content in the ocean, and provide the necessary data to support continuing model development that will lead to improved forecasting skill for oceans and global climate.

E N D
An observational program to monitor the changing patterns of carbon dioxide heat and fresh water content in the ocean, and provide the necessary data to support continuing model development that will lead to improved forecasting skill for oceans and global climate. CO2 Clivar Repeat Hydro
The US CLIVAR/CO2 Repeat Hydrography Program • A committee established by the US CLIVAR Steering Committee and, • the U.S. Carbon Cycle Scientific Steering Group. • In consultation with NSF-OCE (Eric Itsweire and Don Rice) • and NOAA-OGP (Lisa Dilling and Mike Johnson). • Members: • Scott Doney, NCAR doney@ucar.edu • Richard Feely, NOAA/PMEL feely@pmel.noaa.gov • Rana Fine, RSMAS/ U. Miami (co-chair) rfine@rsmas.miami.edu • Nikki Gruber, UCLA ngruber@igpp.ucla.edu • Greg Johnson, NOAA/PMEL gjohnson@pmel.noaa.gov • Terry Joyce, WHOI tjoyce@whoi.edu • Paul Robbins, SIO probbins@ucsd.edu • Jim Swift, SIO jswift@ucsd.edu • Peter Schlosser, LDEO/Columbia U. peterS@ldeo.columbia.edu • Lynne Talley, SIO ltalley@ucsd.edu • Rik Wanninkhof, NOAA/AOML (co-chair) wanninkhof@aoml.noaa.gov CO2 Clivar Repeat Hydro.
Objectives of the Repeat Hydrography Effort • Data for Model Calibration and Validation • Carbon system studies: • * Changes in anthropogenic carbon inventory • * Transport of carbon, oxygen and nutrients • * Large scale natural and anthropogenic variability of biogeochemical properties • Heat and freshwater storage and flux studies: • * Divergence of transport-surface fluxes • * Transport of heat and salt • * Storage of heat and freshwater • * Globally changing inventories of heatand fresh water • Deep and shallow water mass and ventilation studies: • * Changes in subduction and formation rates • * Watermass ages • * Pathways of ventilation • * Rates of dilution • Calibration of autonomous sensors: • * ARGO salinity sensors • * Biogeochemical moorings and floats • * Relationships between sensors and other properties CO2 Clivar Repeat Hydro.
Overall Objective of the Working Group: Draft an U. S. Implementation Plan of Reoccupying Select WOCE/WHP Lines to Detect Changes in Hydrographic and Carbon System Parameters, and Ventilation Tracers on Decadal Timescale. • Subgroups are providing recommendations on: • Synthesis of objectives of the repeat hydrography effort from the myriad of CLIVAR and Carbon Cycle planning documents (Fine & Wanninkhof) • Recommend hydrographic sections and timing of sections for the next decade (with a frequency of about 1.5/year) (Joyce, Feely, & Robbins) • Recommend a suite of core measurements that will be performed on all cruises. Determine cruise specific ancillary measurements and infrastructure needed for ancillary measurements. (Doney, Johnson, & Schlosser) • Provide a data sharing/release protocol and recommend a data management structure. (Talley, Swift, &Gruber) CO2 Clivar Repeat Hydro.
Community outreach and input: • Web site http://www.aoml.noaa.gov/ocd/repeathydro • 1. General information • 2. Participant forum for suites of core measurements • Hydrography, Carbon system measurements, Tracer and Ancillary measurements. • Printed matter: • EOS Vol. 82 (No. 48), November 27, 2001, page 593. • US JGOFS news V11 #3 November 2001 • Presentations: • NOAA GGC program PI meeting, Princeton: Summer 2001: Wanninkhof • JGOFS SC meeting WHOI, Woods Hole Fall 2001: Wanninkhof. • CCSP SC meeting Washington DC Fall 2001: Wanninkhof • CO2 Conference in Sendai,Japan Fall 2001: Gruber • OICES Working Group 13 on CO2 in the North Pacific, Victoria, B.C. O Fall, 2001. Feely • NOAA data management workshop, Seattle: Fall 2001, Dick Feely. • CLIVAR SC meeting Princeton, Winter 2001, Schlosser • Fall AGU, San Francisco, Winter 2001, Fine • WHOI informal research presentation, Woods Hole, Fall 2001, Joyce • AGU/ASLO, Hawaii, Winter, 2002, Wanninkhof CO2 Clivar Repeat Hydro.
Prioritization of Observations Level I, core measurements: Mandatory on all cruises; suggested standard for international collaborators; measured at highest spatial resolution practical; funded through the omnibus proposal across all cruises. Level II, recommended measurements: Highly desirable on subset of US cruises; may be collected on coarser station spacing; coordinated with the core effort. Level III, ancillary measurements: On opportunity and space available basis; not to significantly interfere with Level I or II effort; may be regional or specific to individual cruise; extramural funding. CO2 Clivar Repeat Hydro.
Level I: Core Measurements Rationale based on measurements required to directly quantify change in ocean carbon inventory, estimate anthropogenic CO2 empirically, characterize large-scale water mass ventilation rates, constrain horizontal heat, freshwater, C, N, and O2 transports and/or net divergence, and provide on-going basis for model evaluation. Measurements Dissolved inorganic carbon (DIC) Total Alkalinity (TAlk) CTD pressure, temperature, conductivity (salinity CTD oxygen (sensor) Bottle salinity Nutrients by standard auto analyzer (NO3/NO2, PO4, SiO3) Dissolved oxygen (O2) Chlorofluoro carbon tracers CFC-11, -12, -113 Tritium-3He Total organic carbon Total organic nitrogen Surface underway system: T, S, pCO2 ADCP shipboard ADCP lowered CO2 Clivar Repeat Hydro.
* Level II: related to large-scale carbon cycle and/or ventilation specific rationale listed after measurement; possibly on coarser spatial resolution than Level I but on all cruises pH (internal carbonate system consistency) Discrete pCO2(internal carbonate system consistency) 14C by AMS (bomb penetration; southern ocean circulation changes; may need to repeat only on 20 year time-scale) CCl4 and SF6 (to extend range of age tracers further back in time (CCl4) and into the future (SF6 )) del 13C of DIC (independent measure of anthropogenic CO2 uptake and inventory changes) Fe/trace metals (others? Zn? Al for dust? There are three sampling approaches -on "regular" rosette -Teflon/plastic water sampler hanging below CTD -Separate Kevlar wire; separate casts) Transmissometer (POC distribution; ambiguity as to calibration; regional?) More complete surface underway system: nutrients, O2, Chl, DIC, surface skin temperature CO2 Clivar Repeat Hydro.
* Level III: Upper ocean biogeochemistry and cycling Chlorophyll Primary production (on deck incubations) HPLC pigments (phytoplankton community composition) Experimental continuous analyzers (as they develop and go full depth) del 15N NO3(nutrient utilization) 32Si 18O of H2O NH4 Low level nutrients Total organic phosphorus (difficult to measure??) Upper ocean optical profile (similar to AMT line; algorithm development/validation; short cast; needs to be coherent with biological sampling) del 17O of O2(gross primary production) methyl halides (linkages to SOLAS) DMS (linkages to SOLAS) ADCP (multibeam) ((biological) particle enumeration) CO2 Clivar Repeat Hydro.
Recommendations on Data Management, Data Quality and Data Policies Policies (community data) • CTD, nutrient, and O2 data will be available within 5 weeks after the cruise. • Carbon system and CFC data will be delivered and made available by 6 months after each cruise. • The measurements would be overseen by scientific consortia. • For non-US cruises the WOCE and JGOFS policy of data release is recommended (2-yrs) Management • A two-level data management approach is needed. • At-sea data processing is most effective. Quality • There should be international distribution of a US methods handbook • Comparison studies of international scope are encouraged. CO2 Clivar Repeat Hydro.
Proposed 10-yr United States Schedule for Reoccupation of the WOCE/Global CO2 Survey Lines Line Location Last Proposed Time between Comment Length # A20/22 52/66°W 1997 2003 6 full line 29/21 90/75 A16S 20-25°W 1991 2003 12 full line 44 110 A5 24°N 1992/1998 2003 11/5 UK line P6 32°S 1992 2003 11 Japan line A10 32°S 1992 2003 11 Japan line A16N 20-25°W 1993 2004 11 full line 42 135 P2, Leg1/2 30°N 1994 2004 10 full line 27/39 92/127 P16N, Leg 1/2 150°W 1991 2005 14 full line 30/33 88/100 P10/P9 140°E/137°E 1993/1994 2005 12/11 Japan line P16S 150°W 1991 2005 14 full line 40 105 S4P 67°S 1992 2006 14 full line 51 97 P18, Leg 1/2 105-110°W 1994 2007 13 full line 32/35 78/107 P15 170°W 2001 2008 7 Australia line I7N/I6S 55/20°E 1995/1996 2008 13/12 full line 47/42 156/107 I8S/I9N 90°E 1995 2008 13 full line 38/34 81/103 P12 140°E 2001 2008 7 Australia line I5 32°S 1987/95 2009 22/14 full line 43 145 A13.5 0°E/W 1995 2009 14 full line 62 162 A5 24°N 1998 2010 12/7 full line 30 122 A21/SO4A 65°W 1990/1996 2010 20/14 full line 42 93 A10 32°S 2003 2011 8 full line 29 90 A20/22 66°W 2003 2011 8 full line 29/21 90/75 Notes: For the relevant non-US lines support for tracer and carbon measurements are provided when needed/requested Ordering is by basin: N-S Atlantic, N-S Pacific, North Atlantic, Indian Ocean, Southern Ocean, North Atlantic Coverage based on a zonal cruise in each subtropical basin and sufficient meridional cruises to monitor inventory 2003 - start U.S. Program with Repeat Hydrography in the Atlantic Ocean 2003-2004 focus on the Atlantic Ocean 2004-2007 focus on the Pacific Ocean CO2 Clivar Repeat Hydro.
Proposed US plan of repeat hydrography Black:Proposed US lines (including assistance on non-US cruises) Red: WOCE/WHP lines occupied in the nineties) Courtesy C. Sabine, PMEL CO2 Clivar Repeat Hydro.
A20 A22 P02 A5 A16 P16 P18 I07 I09N A10 I08S A13.5 I06 A21 Background:NCAR Model, of surface anthropogenic CO2 for 2005 CO2 Clivar Repeat Hydro.
Contact Persons for Measurements The working group will focus their planning of measurements on suites of related parameters listed below. The working group members listed after the measurements will serve as contact persons for information exchange: Level 1 Measurements CTD and Hydrography including Oxygen and nutrients: Greg Johnson and Jim Swift Inorganic and Organic Carbon parameters (DIC, TAlk, pCO2, pH and organic C): Richard Feely and Rik Wanninkhof Chloro-Fluorocarbons and tritium/3He: Rana Fine and Peter Schlosser Level 2 Measurements Other ventilation tracers: Rana Fine and Peter Schlosser Other CTD and ADCP: Greg Johnson and Jim Swift Other CO2 & biogeochemical measurements: Niki Gruber and Scott Doney CO2 Clivar Repeat Hydro.
Proposals details • Due March 5 • Core proposal will include level I and level II measurements • Individual proposals in support of the effort are encouraged • Current measurement PI’s: • CTD, NUTS, (L)-ADCP, O2: Swift, Johnson, Mordy, Zhang, Firing, Chereskin, Visbeck, • Baringer • Carbon parameters: Carlson, Dickson Feely, Hansell, Millero, Sabine, Wanninkhof • Tracers: Fine, Bullister, Jenkins, Warner, Smethie, Weiss, Schlosser CO2 Clivar Repeat Hydro.
Potential Chief Scientists A20 2003 Joyce, Toole, Smethie A22 2003 Joyce, Toole, Smethie A16S 2003 Doney, Wanninkhof A16N 2004 Bullister, Gruber P2/1 2004 Swift or Robbins P2/2 2004 Robbins or Swift P16N/1 2005 Feely, Sabine, Talley, McCartney P16N/2 2005 Sabine (or Feely) P16S 2005 Talley, McCartney S4P/P16S 2006 Swift P18/1 2007 McCartney, Talley, Johnson, Bullister P18/2 2007 Johnson, Bullister 17N 2008 I6S 2008 Swift I8S/I9N/1 2008 Sabine, Baringer I8S/I9N/2 2008 Sprintall I5 2009 Robbins "A13.5" 2009 A5 2010 Wanninkhof, Baringer A21/S04A 2010 Swift, Chereskin A10 2010 A20 2011 Joyce, Toole, Smethie A22 2011 Joyce, Toole, Smethie P6 (eastern end): Talley CO2 Clivar Repeat Hydro.
Further issues • How to obtain community input program? • Entraining users of the data products that will be derived from the effort. • Coordination of this effort with international plans which are at different levels of maturity. • Providing a spatial framework for long-term physical and biogeochemical observations at time series and process studies studies to put data in proper regional perspective. • How to coordinate multi-agency funding and multi-agency scientists? CO2 Clivar Repeat Hydro.
International efforts are summarized at: From: http://clivar-search.cms.udel.edu/oceanobs/ CO2 Clivar Repeat Hydro.
Carbon System Studies Changes in anthropogenic carbon inventory Sampling Strategy The number and location of lines strongly influences the uncertainties associated with basin-scale interpolations and inventory estimates. ∆ = +2.8 ∆ = -0.1 ∆ = 0.04 ∆ = -5.1 Sabine and Doney, pers, com. CO2 Clivar Repeat Hydro.
Carbon System Studies Changes in CFC and anthropogenic carbon inventory In µmol/kg CO2 Clivar Repeat Hydro. Wanninkhof et al. Tellus, 1999
Carbon System Studies Changes in anthropogenic carbon inventory Penetration profile In µmol/kg CO2 Clivar Repeat Hydro.
Carbon system studies Changes in anthropogenic carbon inventory Water column inventories CO2 Clivar Repeat Hydro.
Carbon System Studies Carbon Transport and Divergence Ocean transport causes a separation between source and sink regions and locations of inventory change Models and observations show a significant Southward transport of carbon in mid latitudes in the Atlantic. Note, the northward transport is increasing with higher levels anthropogenic carbon in the northward movement of surface water movement. The model runs are from the NCAR Model (graph courtesy of S. Doney) Preindustrial CO2 Clivar Repeat Hydro.
Carbon System Studies Large scale natural variability of biogeochemical properties Biology or physics? 11/97: STUD97 3/91: P16 5/84: Marathon II 8/80: Fiona Following three slides from: Emerson, S., S. Mecking, and J. Abell, The biological pump in the subtropical North Pacific Ocean; Nutrient sources, redfield ratios, and recent changes, Global Biogeochem. cycles, 15, 535-554, 2001. CO2 Clivar Repeat Hydro.
Carbon system studies 11/97-3/91 Large scale natural variability of biogeochemical properties Changes in AOU (red= 20 µmol/kg, blue = -20 µmol/kg) 11/97-5/84 24 11/97-8/80 Density 27 25 40 Latitude CO2 Clivar Repeat Hydro.
Carbon System Studies Large scale natural variability of biogeochemical properties Changes in nitrate (red 2 µmol/kg, blue = - 2 µmol/kg) 11/97-3/91 11/97-5/84 24 11/97-8/80 Density 27 25 40 Latitude CO2 Clivar Repeat Hydro.
Carbon System Studies Large scale natural variability of biogeochemical properties Changes in salinity (red= 0.2 , blue = - 0. 2) 11/97-3/91 11/97-5/84 24 11/97-8/80 Density 27 40 25 Latitude CO2 Clivar Repeat Hydro.
Deep and Shallow Water Mass and Ventilation Studies Rates of transports of major currents The Western Boundary current in the Atlantic Is one of the best studied regions for ventilation CFC-11 measurements at 26.5 ˚N over the past 18 years show the rapid transport of this man-made tracer from the Northern ventilation regions. Also note the apparent episodic nature of transport southward (e..g the very rapid increasebetween 1994 & 1996) (From Molinari, Fine and others, GRL, 2000) CO2 Clivar Repeat Hydro.
Deep and Thermocline Water Mass and Ventilation Studies *Pathways of ventilation *Rates of transports of major currents *Age of water mass 10 10 20 25 CO2 Clivar Repeat Hydro.
Deep and Thermocline Water Mass Ventilation Studies CFC-11 Identify pathways and rates of transport into the thermocline and deep ocean 7/86 10/86 6/90 2/89 8/92 7/94 The Western Boundary current in the Atlantic Is one of the best studied regions for ventilation CFC-11 measurements at 26.5 ˚N over the past 18 years show the rapid transport of this man- made tracer from the Northern ventilation regions. Also note the apparent episodic nature of transport southward (e..g the very rapid increase between 1994 & 1996) (From Molinari, Fine and others, GRL, 2000) 7/96 7/97 CO2 Clivar Repeat Hydro.
Deep and Thermocline Water Mass and Ventilation Studies CFC water column inventories Note similarity with anthropogenic CO2 CO2 Clivar Repeat Hydro.
Heat and Freshwater Storage and Flux Studies 500 - 1000 m Long-term changes in temperature at Bermuda During the 20th century, anomalies in the thermocline (top, after Joyce and Robbins, 1996) show decadal variability but no significant long-term trend, while those at mid-depths (bottom) show both decadal variations and a temperature change of approx. 0.5oC/century. Data are from station “S” (blue lines) and from nearby hydro stations (circles). 1500 - 2500 m CO2 Clivar Repeat Hydro.
Data for Model Calibration and Validation Model: Changes in CO2 uptake patterns: Regions with upwelling/deep water formation show a greater CO2 perturbation flux Changes in DIC inventories: Atlantic boundary current shows greatest column inventory. Tropical/surbtropical gyre region aresignifcant storage regions Lines are model sections shown in subsequent graphs CO2 Clivar Repeat Hydro.
Data for Model Calibration and Validation Anthropogenic CO2 inventory Model: Model: Atlantic Pacific Data based Data based CO2 Clivar Repeat Hydro.
Data for Model Calibration and Validation Model Delta pCO2 model vs. data based estimate Data CO2 Clivar Repeat Hydro.
Data for Model Calibration and Validation Pre-Industrial DIC levels Model Model Atlantic Pacific Data based Data based CO2 Clivar Repeat Hydro.
Carbon measurements at time-series sites (both manned and autonomous) can help reduce biases resulting from seasonal and interannual variability. These sites can also monitor for surprises in ocean circulation or carbon cycle. The black open circles show high priority time-series mooring sites for the Carbon Cycle Science Program