Download
1 / 12
120 likes | 304 Views
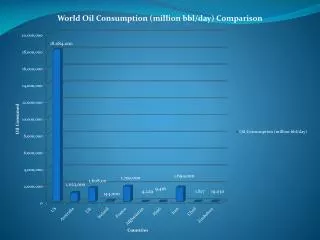
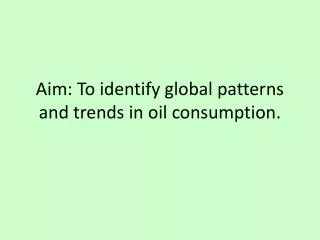
Changing Patterns of Oil Consumption. Spec. Analyse the global patterns and trends in the production and consumption of oil. 2 hours. Proven Oil Reserves. Which countries have the highest proven reserves?. What does this map show?.

E N D
Spec • Analyse the global patterns and trends in the production and consumption of oil. 2 hours
Proven Oil Reserves Which countries have the highest proven reserves?
What does this map show? Crude Petroleum Exports This is where oil is traded from. Use these two maps to describe the spatial distribution of oil production around the world.
Draw an accurate divided bar to show where the 85.4 million barrels of oil produced each day come from.
HEP: China, Canada, Brazil and USA account for 46% of global total World ENERGY stores • COAL: • China produced 41.1% of global coal in 2007 • USA produces 18.7% WIND Germany world leader at 23.6% Germany, USA and Spain account for 58% globally • OIL: • In 2007 the Middle East = 30.8% of oil production • N. America = 16.5% • Saudi Arabia dominates production 12.6% of world’s total • Russia accounts for over ½ of production for Europe and Eurasia • NATURAL GAS: • Russia and USA produce 40% of world’s total
Oil first entered general use around 1900 when the global population was about 1.6 billion. Since then the population has more than quadrupled. When we look at oil production overlaid on the population growth curve we can see a very suggestive correspondence:
Describe the trends in global oil production between 1900 and 2005.
Gap Minder GapMinderOil • Look at how the production trends of Major Producing Nations have varied over time. • Complete this table:
Peak oil is the point in time when the maximum rate of global petroleum extraction is reached, after which the rate of production enters terminal decline. Hubbert Peak Oil Plot
http://www.youtube.com/watch?v=EOm18c5Btiw&feature=player_embeddedhttp://www.youtube.com/watch?v=EOm18c5Btiw&feature=player_embedded