Download

1 / 83
830 likes | 992 Views
OUR OCEAN PLANET. OUR OCEAN PLANET SECTION 2 – FORCES OF NATURE. REVISION HISTORY. 2. FORCES OF NATURE. 2. FORCES OF NATURE. 2.1 NATURAL FORCES. 2.1 NATURAL FORCES. 2.1 NATURAL FORCES. 2.1 NATURAL FORCES

E N D
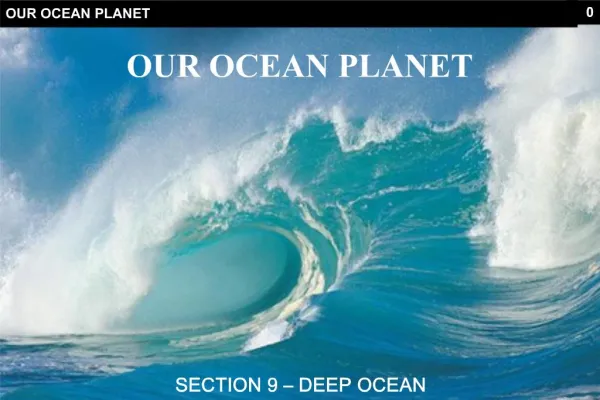
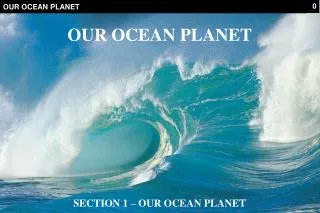
OUR OCEAN PLANET OUR OCEAN PLANET SECTION 2 – FORCES OF NATURE
2. FORCES OF NATURE 2. FORCES OF NATURE
2.1 NATURAL FORCES 2.1 NATURAL FORCES
2.1 NATURAL FORCES 2.1 NATURAL FORCES Oceans are not static bodies of water but are highly dynamic and are affected by many natural forces. These forces, acting on the ocean, are responsible for the Earth’s weather and climate. The following sections describe some of the most important forces acting upon the oceans. 2.2.1 Sun The Sun is the heat engine of our planet. Even having traveled millions of kilometers, the Sun’s rays still release 130 trillion horsepower per second on Earth. It causes evaporation in oceans and lakes, and clouds to develop. It creates the winds as air heats up, and drives both the clouds and ocean currents. It controls our climate and, with the Moon, influences tides.
2.1 NATURAL FORCES 2.1.2 Moon The Moon is Earth’s only natural satellite and orbits the Earth approximately every 28 days. The Earth and Moon also orbit the Sun. The relative alignment of the Sun, Earth and the Moon gives us different views of the Moon. There are 8 views (or “phases”) of the moon, namely: • New Moon • Waxing Crescent Moon • First Quarter Moon • Waxing Gibbous Moon • Full Moon • Waning Gibbous Moon • Last Quarter Moon • Waning Crescent Moon Note: “Waxing" means growing and refers to the size of the illuminated part of the moon that is increasing. The Moon has a powerful effect on tides. The Moon also has an effect on the reproduction of many living creatures including sea turtles, groupers and corals.
2.1 NATURAL FORCES 2.1.3 Coriolis Effect The Earth’s rotation also has an effect on winds and currents. The Coriolis Effect describes the curving motion of wind caused by the Earth's rotation. Instead of blowing directly north or south, air deflects to the right in the northern hemisphere and to the left in the southern hemisphere. 2.1.4 Volcanoes Volcanoes form when magma reaches the Earth's surface, causing eruptions of lava and ash. A volcanic eruption can seriously affect global weather and climate patterns. For example, in Hawaii, when lava flows reach the ocean, the ocean cools and solidifies it into new land. Steam plumes rise into the atmosphere affecting rain patterns globally. 2.1.5 Earthquakes & Seaquakes Earthquakes are caused by the release of built-up pressure inside the Earth's crust in the form of seismic waves. The effects of an earthquake can be devastating – changed landscapes, destroyed settlements and tremendous loss of life. An earthquake’s power is measured on the Richter scale using an instrument called a seismometer. When an earthquake occurs in the ocean, it is known as a seaquake. Seaquakes can trigger huge ocean waves that can swamp low lying areas.
2.2 PHYSICAL OCEAN PROCESSES 2.2 PHYSICAL OCEAN PROCESSES
2.2 PHYSICAL OCEAN PROCESSES 2.2 PHYSICAL OCEAN PROCESSES Natural forces, such as the sun and moon act on the ocean to form Earth’s winds, waves, tides and currents, and to create special weather patterns. Over a longer time scale, these natural forces can also result in major changes in the Earth’s climate. WEATHER The term “ weather” describes whatever is happening outdoors in a given place at a given time. Weather happens from minute to minute and can change rapidly within a very short time. For example, it may rain for an hour and then become sunny and clear. The weather is also typically what we hear about in the daily news. Daily weather reports include information about changes in precipitation, barometric pressure, temperature, and wind conditions at a given location. CLIMATE In contrast, the term “climate” describes the total of all weather occurring over a period of years in a given place. This includes average weather conditions, regular weather sequences (such as winter, spring, summer, and fall), and special weather events (like tornadoes and floods). Climate tells us what it's usually like in the place where you live. For example, New Orleans has a humid climate, Buffalo, New York a snowy climate, and Seattle a rainy climate. The Cayman Islands have a tropical climate and are usually warm.
2.2 PHYSICAL OCEAN PROCESSES 2.2.1 Rain The ocean absorbs much of the solar radiation reaching Earth. The ocean loses heat by evaporation. This heat loss drives atmospheric circulation when, after it is released into the atmosphere as water vapour, it condenses and forms rain. Condensation of water evaporated from warm seas provides the energy for hurricanes and cyclones. 2.2.2 Winds The amount of the Sun’s heat energy penetrating the surface of the Earth varies. The sun’s energy has a longer way to travel at the poles and with less heat at the poles and more heat at the equator, a major pressure gradient exists. Winds are driven by these differences or gradients. As the air heats up, it becomes less dense and rises. To fill the gap produced underneath, air rushes in from adjacent areas creating winds. In the tropics, these winds are known as the “trade winds”. These winds do not just blow south in the northern hemisphere and north in the southern hemisphere but also blow slightly west due to the rotation of the Earth (Coriolis Effect).
2.2 PHYSICAL OCEAN PROCESSES TROPICAL CYCLONES, HURRICANES & TYPHOONS In tropical oceans, water evaporates and heat is transferred to the atmosphere. As the air warms, it becomes less dense and rises in a spiral, drawing yet more air upwards. This rising air has a heavy load of moisture, which, as it reaches higher altitudes, cools and condenses, releasing heat. The energy from this heat increases the speed of the air, creating spiraling winds. In the center of the spiral is a calm region of low pressure. This contrasts dramatically with the high-pressure, fast-moving, cloud-filled air of the surrounding spiral. While the developing hurricane is over the ocean, it is fed with energy from the warm, moist, rising air, and its speed and ferocity increases. Over land, however, a hurricane loses power as it is no longer fed by the warm ocean and the increased friction over land disrupts the spiral. Tropical cyclones with a maximum wind speed of less than 60 km/hr are called tropical depressions; when the maximum wind speed ranges between 60 and 110 km/hr, they are tropical storms, and when the maximum wind speed exceeds 110 km/hr, they are called tropical cyclones. In the North Atlantic and eastern North Pacific regions, tropical cyclones are called "hurricanes". In the western North Pacific, they are called "typhoons" (which appropriately means “big wind” in Chinese).
2.2 PHYSICAL OCEAN PROCESSES HURRICANE NAMES The naming of storms differs from place to place. In the Atlantic, storms are named alphabetically by year and alternate between male and female names. Six lists are used in rotation. Thus, the 2008 list will be used again in 2014. The only time that there is a change in the list is if a storm is so deadly or costly that the future use of its name on a different storm would be inappropriate for reasons of sensitivity. If that occurs, the offending name is stricken from the list and another name is selected to replace it. REFERENCES & FURTHER READING http://www.srh.noaa.gov/srh/jetstream/index.htm http://www.nasa.gov/mission_pages/hurricanes/main/index.html http://www.nhc.noaa.gov/aboutnames.shtml http://www.nhc.noaa.gov/2004ivan.shtml
2.2 PHYSICAL OCEAN PROCESSES 2.2.3 Waves Waves are vibrations or oscillations moving through a medium (or vacuum) transferring energy as they move. As a wave passes, each bit of the medium vibrates in turn but stays where it is – it doesn’t move with the wave. Think of a crowd wave at a football game. The wave moves round the ground but each spectator stays in their seat vibrating when it's their turn to stand up and sit down. Water and sound waves need a solid, liquid or gas medium to move through but electromagnetic waves (e.g. light, radio, microwave, infrared, ultraviolet, etc.) can travel in a vacuum. There are two main types of wave which vibrate differently: (a) Transverse – the vibrations are at right angles to the direction of the wave. Examples are electromagnetic waves (light, etc.), water waves, and shear or shake seismic waves. (b) Longitudinal – the vibrations are along the same direction as the waves. Examples are sound waves, waves in a stretched spring, and push or pressure seismic waves (which are generated during earthquakes and faulting).
2.2 PHYSICAL OCEAN PROCESSES • OCEAN WAVES • An ocean wave is a transverse wave. It has a: • Crest or Peak – the highest point of the wave • Trough – the lowest point of the wave • Wavelength – the distance between two crests (or troughs) • Amplitude – the maximum disturbance during a wave cycle • Frequency – how quickly a wave moves forward • Most ocean waves are created by the wind blowing across the open ocean and causing the surface water to ripple. If the wind continues to blow, the ripples grow larger and turn into waves. The height of waves depends on the strength and duration of the wind causing them and how far they have been pushed across the ocean – this distance is known as the “fetch”.
2.2 PHYSICAL OCEAN PROCESSES TSUNAMI (“SOO-NAH-ME”) A “tsunami” is a very large and, potentially, destructive wave. It forms when a disturbance such as a landslide, volcanic eruption or undersea earthquake causes ripples in the ocean similar to a stone thrown into a pond. A tsunami has very small amplitude offshore and a very long wavelength (often hundreds of kilometers long). It can pass almost unnoticed at sea forming only a slight swell (usually only 30 cm (1 ft) above the normal sea level) but this still represents a huge volume of rapidly-moving seawater. As it approaches land and the ocean becomes very shallow, the water can inundate coastal areas. REFERENCES & FURTHER READING http://www.ypte.org.uk/docs/factsheets/env_facts/tsunami.html http://www.bbc.co.uk/schools/gcsebitesize/physics/waves/whatarewavesrev1.shtml http://news.nationalgeographic.com/news/2004/12/1228_041228_tsunami.html
2.2 PHYSICAL OCEAN PROCESSES 2.2.4 Tides If you have ever watched the ocean washing onto a beach over an extended period of time, you may have seen the water washing higher up on the shore at one time and much lower down the shore a few hours later. This rising and falling of the sea level is called the “tide”. High tide is when the water is furthest up the beach while low tide is when the water furthest away from shore. Tides may be semidiurnal (two high waters and two low waters each day), or diurnal (one tidal cycle per day). In most locations, tides are semidiurnal. Tides are caused by the gravitational pull of the Moon and the Sun on the rotating Earth’s surface. As the Moon rotates around the Earth, the water is pulled toward to Moon and forms the daily tides. The Sun also has effects the tides because of its great mass, but it is about half as much as that of the Moon because the Sun is much further away from the Earth.
2.2 PHYSICAL OCEAN PROCESSES Spring tides are caused when the Full Moon (and again with the New Moon) lines up in a straight path with the Sun and the Earth. When the Moon and Sun are in line with the Earth, they work together. Spring tides (which occur twice a month all year) rise higher and fall lower than normal.
2.2 PHYSICAL OCEAN PROCESSES Neap tides are caused when the Sun, the Earth and the Moon (in the first and third quarters) are at right angles to each other. These tides are unusually low because the pull of the Moon and the pull of the Sun somewhat cancel each other out as they engage in a tidal tug of war. Neap tides have the smallest difference in water levels between high and low tide.
2.2 PHYSICAL OCEAN PROCESSES BUILDING TOO CLOSE TO SEA LEVEL People must be careful when they build homes, cities and businesses near the shore. We must take into account high tides and other factors such as hurricanes or storms that can temporarily alter the sea level. Several famous cities, including Venice and New Orleans, have been built so that they are dangerously close to sea level (or actually below sea level). As a result, the inhabitants must constantly remain vigilant and build special structures to keep the ocean from flooding their cities. In Venice, tides can be so high that St. Mark’s Square, at the centre of the city, can be under 0.5 m (1.5 ft) of water for several hours. Inhabitants put up temporary platforms so that people can walk across the square. In New Orleans, high waves caused by Hurricane Katrina in 2005 eventually broke the dams (“levees”) that the people of New Orleans had constructed to keep the ocean out. The city was flooded by overflowing lakes and a huge amount of damage was done. REFERENCES & FURTHER READING http://en.wikipedia.org/wiki/Tide http://www.weatherincayman.com/tideprediction.html http://www.tide-forecast.com/ http://en.wikipedia.org/wiki/Hurricane_Katrina
2.2 PHYSICAL OCEAN PROCESSES 2.2.5 Currents Ocean currents are masses of water that flow in a set direction for thousands of kilometers. They are important because they affect the climates of the continents especially those regions bordering on the ocean. Perhaps the most striking example is the Gulf Stream, which makes northwest Europe much more temperate than any other region at the same latitude. Another example is the Hawaiian Islands, where the climate is somewhat cooler (sub-tropical) than the tropical latitudes in which they are located because of the cold California Current. There are several types of current: 1. Surface Currents The best-known are wind-caused currents where the wind pushes the water along the surface. Surface ocean currents develop typical clockwise spirals in the northern hemisphere and anti-clockwise rotation in the southern hemisphere.
2.2 PHYSICAL OCEAN PROCESSES 2. Deep Currents There are also deep currents that flow vertically and horizontally beneath the surface. These are mainly caused by differences in the density of adjacent waters and fall into two groups: (a) Salinity Currents – Thermohaline Circulation The thermohaline circulation (THC) is the global density-driven circulation of the oceans. The name comes from “thermo” (heat) and “haline” (salt) which together determine the density of sea water. Wind-driven surface currents (such as the Gulf Stream) cool as they move pole-wards from the equatorial Atlantic Ocean and eventually sink at high latitudes. This dense water then flows into the ocean basins. While the bulk of it upwells in the Southern Ocean, the oldest waters (with a transit time of around 1,600 years) upwell in the North Pacific. Extensive mixing therefore takes place between the ocean basins, reducing differences between them and making the Earth's ocean a global system. The circulation transports energy (heat) and matter (solids, dissolved substances and gases such as oxygen) around the globe. (b) Temperature Currents – Hydrothermal Circulation Hydrothermal circulation is the circulation of hot water (“hydro” meaning water and “thermo” meaning heat). Hydrothermal circulation occurs in the vicinity of sources of heat within the Earth's crust such as the seafloor or near volcanic activity. For example, hydrothermal circulation in the oceans occurs through mid-oceanic ridge systems. Cold dense seawater sinks into the basalt of the seafloor and is heated at depth whereupon it rises back to the rock/ocean water interface due to its lesser density. The heat source is the basalt or the underlying magma chamber. Hydrothermal vents are locations on the seafloor where hydrothermal fluids mix into the overlying ocean. Perhaps the best known vent forms are the chimneys referred to as “black smokers”.
2.2 PHYSICAL OCEAN PROCESSES REFERENCES & FURTHER READING http://en.wikipedia.org/wiki/Thermohaline_circulation http://en.wikipedia.org/wiki/Hydrothermal_circulation
2.2 PHYSICAL OCEAN PROCESSES 2.2.6 El Niño and La Niña The name “El Niño” (Spanish for the "Christ child" or “little boy”) was originally coined in the late 1800s by fishermen along the coast of Peru to refer to a seasonal invasion of warm, southward, ocean current that displaced the north-flowing cold current in which they normally fished; typically this would happen around Christmas. Today, the term no longer refers to the local seasonal current shift but to part of a phenomenon known as El Niño-Southern Oscillation (ENSO), a continual but irregular cycle of shifts in ocean and atmospheric conditions that affect the globe. El Niño has come to refer to the more pronounced weather effects associated with anomalously warm sea surface temperatures interacting with the air above it in the eastern and central Pacific Ocean. Its counterpart – effects associated with colder-than-usual sea surface temperatures in the region – was labeled "La Niña" (or "little girl").
2.2 PHYSICAL OCEAN PROCESSES El Niño is not totally predictable but occurs on average once every four to seven years, and usually lasts for about 18 months after it begins. El Niño events are accompanied by swings in the Southern Oscillation (SO), an inter-annual see-saw in tropical sea level pressure between the eastern and western hemispheres. During El Niño, unusually high atmospheric sea level pressures develop in the western tropical Pacific and Indian Ocean regions, and unusually low sea level pressures develop in the southeastern tropical Pacific. Southern Oscillation tendencies for unusually low pressures west of the date line and high pressures east of the date line have also been linked to periods of unusually cold equatorial Pacific sea surface temperatures (SSTs) sometimes referred to as La Niña (or the "little girl").
2.2 PHYSICAL OCEAN PROCESSES The effects of El Niño vary widely with geography. For people who live in Indonesia, Australia, or southeastern Africa, El Niño can mean severe droughts and deadly forest fires. Ecuadorians, Peruvians, or Californians, on the other hand, associate it with lashing rainstorms that can trigger devastating floods and mudslides. Severe El Niño events have resulted in several thousand deaths worldwide, left thousands of people homeless, and caused billions of dollars in damage. Yet residents on the northeastern seaboard of the United States can also credit El Niño with milder-than-normal winters (and lower heating bills) and relatively benign hurricane seasons. REFERENCES & FURTHER READING http://www.pmel.noaa.gov/tao/elnino/nino-home.html http://www.pmel.noaa.gov/tao/elnino/el-nino-story.html http://www.pmel.noaa.gov/tao/elnino/la-nina-story.html http://www7.nationalacademies.org/opus/elnino.html http://www.epa.gov/climatechange/kids/climateweather.html
2.3 CARBON 2.3 CARBON
2.3 CARBON 2.3 CARBON Carbon is critical to life on earth. In fact, carbon constitutes the very definition of life, as its presence or absence helps define whether a molecule is considered to be organic or inorganic. Every organism on Earth needs carbon for structure, energy or, as in the case of humans, both. Discounting water, you are about half carbon. Additionally, carbon is found in forms as diverse as carbon dioxide (CO2) gas and in solids such as limestone (CaCO3), wood, plastic, diamonds, and graphite. 2.3.1 Carbon Cycle The carbon cycle consists of a set of geological, physical, chemical and biological processes that move carbon between the atmosphere, oceans, geosphere and biosphere. The geological processes operate on a time scale of millions of years while the biological processes operate on a time scale of days to thousands of years.
2.3 CARBON Geological processes have acted on the global carbon cycle since the formation of the Earth. Over long periods of time, carbonic acid (a weak acid formed by reactions between atmospheric carbon dioxide (CO2) and water) slowly combines with minerals at the earth’s surface. These reactions form carbonates (carbon-containing compounds) through a process called weathering. Then, through erosion, carbonates are washed into the ocean where they settle to the bottom. The carbonates can be used by organisms to build their skeletons or shells. For example, coral skeletons are made of calcium carbonate (limestone). Seafloor spreading pushes the seafloor under continental margins in the process of subduction. As seafloor carbon is pushed deeper into the Earth by tectonic forces, it heats up, eventually melts and can rise back up to the surface, where it is released as CO2 and returned to the atmosphere. This return can occur violently through volcanic eruptions or more gradually in seeps, vents and CO2-rich hot springs. Weathering, subduction, and volcanism control atmospheric CO2 concentrations over time periods of hundreds of millions of years.
2.3 CARBON Biological processes play an important role in the movement of carbon between land, ocean, and atmosphere through the processes of photosynthesis and respiration. Plants take in CO2 from the atmosphere during photosynthesis and release CO2 into the atmosphere during respiration: Virtually all multi-cellular life on Earth depends on plants producing carbohydrates (sugars) and oxygen from sunlight, CO2 and water (photosynthesis) and the metabolic breakdown (respiration) of those carbohydrates to produce the energy needed for movement, growth, and reproduction. The amount of carbon taken up by photosynthesis and released back to the atmosphere by respiration each year is about 1,000 times greater than the amount of carbon that moves through the geological cycle on an annual basis.
2.3 CARBON In the oceans, some organisms have calcium carbonate (CaCO3) shells or skeletons. When these organisms die, the shells settle to the bottom of the ocean and are buried in the sediments. The shells of phytoplankton and skeletons of dead coral can become compressed over time and are eventually transformed into limestone. Additionally, under certain geological conditions, organic matter can be buried and over time form deposits of the carbon-containing fuels coal and oil. It is the non-calcium containing organic matter that is transformed into fossil fuel. Both limestone and fossil fuel formation are biologically controlled processes and represent long-term sinks for atmospheric CO2. When humans burn fossil fuels, we release this CO2 in the atmosphere. On land, the major exchange of carbon with the atmosphere results from photosynthesis and respiration. During daytime in the growing season, leaves absorb sunlight and take up CO2 from the atmosphere. At the same time plants, animals, and soil microbes consume the carbon in organic matter and return CO2 to the atmosphere. Photosynthesis stops at night when the sun cannot provide the driving energy for the reaction although respiration continues.
2.3 CARBON REFERENCES & FURTHER READING http://www.eo.ucar.edu/kids/green/cycles6.htm http://www.visionlearning.org/library/module_viewer.php?c3=1&l=1&mid=95
2.3 CARBON 2.3.2 Global Climate Change The Earth has gone through many natural climatic changes through geologic time. These climatic changes can result in major changes in the ocean’s circulation which can, in turn, produce larger and even more abrupt changes in climate. Recently, however, the level of carbon dioxide in the atmosphere has risen dramatically along with an increase in global average temperature. How much of this is natural and how much is due to human activity has been hotly debated. For example, during winter in the northern hemisphere, photosynthesis ceases when many plants lose their leaves but respiration continues, which leads to a natural increase in atmospheric CO2 concentrations. With the onset of spring, however, photosynthesis resumes and atmospheric CO2 concentrations are reduced. This cycle is reflected in the monthly means of atmospheric CO2 concentrations shown by the oscillations in the graph. Disturbingly, however, the long-term trend shows that CO2 concentration is steadily rising. The graph is known as the “Keeling curve” after the scientist who first recorded and plotted the data.
2.3 CARBON Since the onset of the industrial revolution about 150 years ago, human activities such as the burning of fossil fuels and deforestation have accelerated, and both have contributed to a long-term rise in atmospheric CO2. Burning oil and coal releases carbon into the atmosphere far more rapidly than it is being removed and this imbalance causes atmospheric CO2 concentrations to increase. In addition, by clearing forests, we reduce the ability of photosynthesis to remove CO2 from the atmosphere also resulting in a net increase. Studies that look at CO2 trapped in ice cores have provided evidence that atmospheric CO2 concentrations are higher today than they have been over the last half-million years or longer. These highly increased levels have been directed attributed to human activities,
2.3 CARBON EFFECTS OF INCREASED CARBON DIOXIDE LEVELS – “WARMING” Scientists believe the increase in CO2 is already causing important changes in the global climate. Because CO2 increases the atmosphere’s ability to hold heat, it is called a “greenhouse gas”. Many attribute the observed 0.6°C increase in global average temperature over the past century to increases in atmospheric CO2. Without substantive changes in global patterns of fossil fuel consumption and deforestation, warming trends are likely to continue. The best scientific estimate is that global mean temperature will increase between 1.4°C and 5.8°C over the century as a result of increases in atmospheric CO2 and other greenhouse gases. The increase in global temperature would cause significant rise in average sea-level (0.09-0.88m) exposing low-lying coastal cities and low-lying islands to increasingly frequent and severe floods. Glacial retreat and species range shifts are also likely to result from global warming. Increased concentrations of CO2 could have an important impact on plant growth patterns. Because some species of plants respond more favorably to increases in CO2 than others, scientists believe we may see pronounced shifts in plant species, even without any change in temperature. For example, under elevated CO2 conditions, shrubs may respond more favourably than certain grasses due to their slightly different photosynthetic pathway. Because of this competitive inequality, some scientists have hypothesized that grasslands will be invaded by CO2 -responsive grass species or shrubby species as CO2 levels increases. REFERENCES & FURTHER READING http://www.bbc.co.uk/sn/climateexperiment/ http://www.ncdc.noaa.gov/oa/climate/globalwarming.html
2.4 ACTIVITIES 2.4 ACTIVITIES
2.4 ACTIVITIES 2.4 ACTIVITIES 2.4.1 Winds CORE ACTIVITY Investigate winds and hurricanes, and their effects (a) How do winds form? (b) How do tropical cyclones form? (c) What is a “hurricane”? What is a “typhoon”? (d) Read the page on naming of tropical cyclones: http://www.nhc.noaa.gov/aboutnames.shtml. How are storms named in the Atlantic? What are this year’s tropical cyclone names? (e) Read the page on Hurricane Ivan: http://www.nhc.noaa.gov/2004ivan.shtml to get a sense of the power of a hurricane. What were some effects of Hurricane Ivan on the Cayman Islands?
2.4 ACTIVITIES ANSWERS Investigate winds and hurricanes, and their effects (a) How do winds form? Winds are driven by heat from the sun. Most of this energy is absorbed in the tropics. As the air heats up, it becomes less dense and rises. To fill the gap produced underneath, air rushes in from adjacent areas creating winds. In the tropics, these winds are known as the “trade winds”. (b) How do tropical cyclones form? In tropical oceans, water evaporates and heat is transferred to the atmosphere. As the air warms, it becomes less dense and rises in a spiral, drawing yet more air upwards. This rising air has a heavy load of moisture, which, as it reaches higher altitudes, cools and condenses, releasing heat. The energy from this heat increases the speed of the air, creating spiraling winds. In the center of the spiral is a calm region of low pressure. This contrasts dramatically with the high-pressure, fast-moving, cloud-filled air of the surrounding spiral. While the developing hurricane is over the ocean, it is fed with energy from the warm, moist, rising air, and its speed and ferocity increases. Over land, however, a hurricane loses power as it is no longer fed by the warm ocean and the increased friction over land disrupts the spiral.
2.4 ACTIVITIES (c) What is a “hurricane”? What is a “typhoon”? Tropical cyclones with a maximum wind speed of less than 60 km/hr are called tropical depressions; when the maximum wind speed ranges between 60 and 110 km/hr, they are tropical storms, and when the maximum wind speed exceeds 110 km/hr, they are called tropical cyclones. In the North Atlantic and eastern North Pacific regions, tropical cyclones are called "hurricanes". In the western North Pacific, they are called "typhoons". (d) Read the page on naming of tropical cyclones: http://www.nhc.noaa.gov/aboutnames.shtml. How are storms named in the Atlantic? What are this year’s tropical cyclone names? The naming of storms differs from place to place. In the Atlantic, storms are named alphabetically by year and alternate between male and female names. Six lists are used in rotation. Thus, the 2008 list will be used again in 2014. The only time that there is a change in the list is if a storm is so deadly or costly that the future use of its name on a different storm would be inappropriate for reasons of sensitivity. If that occurs, the offending name is stricken from the list and another name is selected to replace it. In 2008, they are Arthur, Bertha, Cristobal, Dolly, Edouard, Fay, Gustav, Hanna, Ike, Josephine, Kyle, Laura, Marco, Nana, Omar, Paloma, Rene, Sally, Teddy, Vicky, and Wilfred.
2.4 ACTIVITIES (e) Read the page on Hurricane Ivan: http://www.nhc.noaa.gov/2004ivan.shtml to get a sense of the power of a hurricane. What were some effects of Hurricane Ivan on the Cayman Islands? • Although Ivan was weakening while the center passed south of Grand Cayman on 12 September, 2004, the hurricane still brought sustained winds just below Category 5 strength to the island. This resulted in widespread wind damage, and a storm surge that completely over swept the island except for the extreme northeastern portion. • Sustained winds of 130 knots (150 mph) and gusts of 149 knots (172 mph) • Heavy rainfall caused extensive freshwater flooding and mud slides. Peak rainfall totals were 12.14 inches from Grand Cayman. • Severe storm surge flooding of 8-10 ft with 20-30 ft waves caused more than 5-8 ft of water to cover Grand Cayman Island at times. This resulted in the airport and numerous homes being completely inundated by sea water. • 2 deaths • 95% of homes and other buildings damaged or destroyed. • US$1.85 billion damage in the Cayman Islands.
2.4 ACTIVITIES 2.4.2 Waves CORE ACTIVITY Investigate waves and their effects (a) Label the diagram with the following terms: • Crest/Peak • Trough • Wavelength • Amplitude • Vibration/Oscillation Direction (up and down) • Wave Direction (left to right)
2.4 ACTIVITIES (b) What types of waves do not need solid-liquid-gas medium to travel through? (c) Describe some of the characteristics of a tsunami (d) How can we prepare for a possible tsunami?
2.4 ACTIVITIES ANSWERS Investigate waves and their effects (a) Label the diagram with the following terms: • Crest/Peak • Trough • Wavelength • Amplitude • Vibration/Oscillation Direction (up and down) • Wave Direction (left to right)
2.4 ACTIVITIES (b) What types of waves do not need solid-liquid-gas medium to travel through? Electromagnetic waves (e.g. light, radio, microwaves, etc) (c) Describe some of the characteristics of a tsunami A “tsunami” (“soo-nah-me”) is a very large and, potentially, destructive wave. It is formed when a disturbance such as a landslide, volcanic eruption, or undersea earthquake causes a ripple effect similar to a stone thrown into a pond. A tsunami has very small amplitude (wave height) offshore and a very long wavelength (often hundreds of kilometers long). It can pass almost unnoticed at sea forming only a slight swell (usually only 30 cm (1 ft) above the normal sea surface) but this still represents a huge volume of rapidly moving seawater. As it approaches land and the depth of the ocean becomes very shallow, the water can inundate coastal areas. Tsunamis can travel thousands of kilometers across the ocean and still have enough energy to cause massive damage when they make landfall. (d) How can we prepare for a possible tsunami? • Monitoring stations in the ocean and advanced notification • Build settlements that are well above sea-level • Use sea-walls in low-lying areas
2.4 ACTIVITIES 2.4.3 Tides EXTENDED ACTIVITY (a) The following data are typical tide data over 3 days. The date is given followed by the sunrise, sunset, moonrise and moonset time. There are two high tides and two low tides per day. The times and heights (in meters) for low and high tides are given relative to 0 where 0 is the average sea level. Thus, a time of 0125 means 1:25 am while a tide value of 1.1 means the high tide level is 1.1 m above sea level. Students should plot the data on a chart and join up the points.
2.4 ACTIVITIES (b) When was the highest tide? When was the lowest tide? (c) What things affect the tide?
2.4 ACTIVITIES ANSWERS (a) The following data are typical tide data over 3 days. The date is given followed by the sunrise, sunset, moonrise and moonset time. There are two high tides and two low tides per day. The times and heights (in meters) for low and high tides are given relative to 0 where 0 is the average sea level. Thus, a time of 0125 means 1:25 am while a tide value of 1.1 means the high tide level is 1.1 m above sea level. Students should plot the data on a chart and join up the points.