3D Analyst for ArcView
3D Analyst for ArcView. What can you do with 3D Analyst? Create realistic surface models from multiple input sources Determine height at any location on a surface Find what is visible from an observation point Calculate the volumetric difference between two surfaces (cut and fill)


3D Analyst for ArcView
E N D
Presentation Transcript
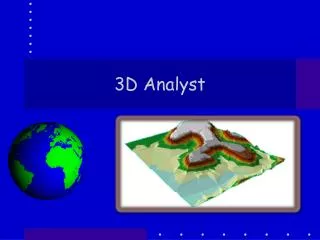
3D Analyst for ArcView 3D Analyst
What can you do with 3D Analyst? • Create realistic surface models from multiple input sources • Determine height at any location on a surface • Find what is visible from an observation point • Calculate the volumetric difference between two surfaces (cut and fill) • Working with 3D vector features to make realistic models of the 3D world • Visualize your data in 3D • and much, much more….. 3D Analyst
How to create a realistic surface model form multiple sources. • Making a quick 3D model. • Showing data in a 3D to be visualized. 3D Analyst
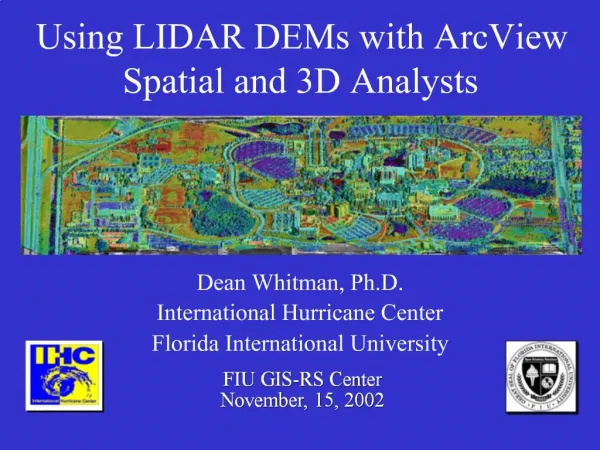
Making a quick surface model from multiple sources • Two types of surfaces can be used in 3D Analyst • 1.Grids (A matrix of square cells) • 2.TINs (Triangulated Irregular Network) nonoverlapping triangles • What can be used to make a surface? • Surfaces can be created from a wide variety of data sources. • You can make grids by importing USGS DEMs, DTED files, ASCII files, or even image formats. • TINs can be created from points, lines, polygons, and Grids. 3D Analyst
Making a TIN from Points and Lines. • You must have elevation data (Z value) with your shapefiles in order to create a TIN. • To make a simple surface model you will need- • At least a shapefile with elevation data (Z Value). 3D Analyst
Select Create TIN Choose your source of elevation from the table here. Make sure that the theme or themes you wish to use are active Select which features you want to define info for. Choose what kind of input brakelines or mass points 3D Analyst
Your new surface is ready. You will be asked to give a location to save your TIN. Your new Tin will be placed in your view. 3D Analyst
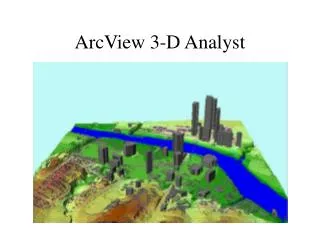
To View your surface in 3D Go to view and select 3D scene. 3D Scene window will appear with your data. You can move around your surface and themes. Change sun location and much more….. 3D Analyst
Making a quick 3D model. • The city of Kansas City, Missouri has been working on a 3D model of the center city (the loop) to Crown Center. • The reason ArcView is being used is its quick way of making a model over other software programs such as MicroStation. 3D Analyst
The building information was collected by a city worker for the number of floors in each building. • There is also the problem that not all buildings have the same height between floors as other buildings. For example the new Federal Court House is only 9 Stories tall, but is about 20 feet per story while City Hall is 30 stories tall, but is about 10 feet per story. • Since this effects the look of a building this information was collected as well (mostly estimated). 3D Analyst
The building shapes are from the city planimetric data of the last fly over. • A in-house avenue script allows us to click on a building in the view and add its number of stories and floor height to a database. • Once the information is collected and entered you can start to view the buildings 3D. There does not have to be a surface present to view the buildings in 3D. 3D Analyst
There is one down fall of using the building foot prints. Some of the buildings are shown as simple blocks but are really complex. • A Method called the wedding cake is applied, by adding many polygons in different shapes to show a building. The Jackson County Court House is shown as it appears in real life. City Hall shows up as a box. When it is not in real life. 3D Analyst
Once you have your data it is simple to view your new buildings in 3D. • As like before you need to select a 3D scene to view your data. • Once your scene is active you will need to make your builds appear 3D. 3D Analyst
Then go to theme and 3d Properties. Make sure the building theme is active. 3D Analyst
This the base heights for you data. If you are not using a surface use zero. To make the buildings 3D click on the calc. Button. The expression builder is where you assign the buildings their height. We use our stories times the floor height. 3D Analyst
3D buildings 3D Analyst
Other Types of Data can be used too. • You can use data such as population patterns or growth to be view 3D. 3D Analyst