Download
1 / 25
250 likes | 445 Views
The log-rate model Statistical analysis of occurrence-exposure rates. References. Laird, N. and D. Olivier (1981) Covariance analysis of censored survival data using log-linear analysis techniques. Journal of the American Statistical Institute, 76(374):231-240

E N D
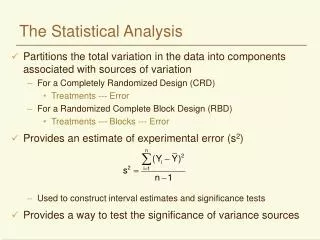
The log-rate modelStatistical analysis of occurrence-exposure rates
References Laird, N. and D. Olivier (1981) Covariance analysis of censored survival data using log-linear analysis techniques. Journal of the American Statistical Institute, 76(374):231-240 Holford, T.R. (1980) The analysis of rates and survivorship using log-linear models. Biometrics, 36:299-305 Yamaguchi, K. (1991) Event history analysis. Sage, Newbury Park, Chapter 4:’Log-rate models for piecewise constant rates’
The log-rate model: the occurrence matrix and the exposure matrix Occurrences: Number leaving home by age and sex, 1961 birth cohort: nij Exposures: number of months living at home (includes censored observations): PMij
ij = E[Nij] PMij fixed The log-rate model offset The log-rate model is a log-linear model with OFFSET (constant term)
The log-rate model Multiplicative form Addititive form Ln(PM): offset : linear predictor The log-rate model is a log-linear model with OFFSET (constant term)
The log-rate model in two steps • Use the model to predict the counts (predict counts from marginal distribution of occurrences and from exposures): IPF • Estimate parameters of log-rate model from predicted values using conventional log-linear modeling • The model:
The log-rate model in SPSS: unsaturated model Model and Design Information: unsaturated model Model: Poisson Design: Constant + SEX + TIMING Parameter Estimates Asymptotic 95% CI Parameter Estimate SE Lower Upper 1 -3.9818 .0694 -4.12 -3.85 2 .5070 .0878 .33 .68 3 .0000 . . . 4 -1.3044 .0897 -1.48 -1.13 5 .0000 . . .
The log-rate model in SPSS: unsaturated model PM *exp[ ] = RATE 9114*exp[-3.982 ] = 170.0 0.01865 16202*exp[-3.982-1.304 ] = 82.0 0.00506 15113*exp[-3.982-1.304+0.507] = 127.0 0.00840 4876*exp[-3.982+ 0.507] = 151.0 0.03096
The log-rate model in GLIM: unsaturated modelOcc = Exp * exp[overall + sex] DATA: Occurrence matrix and exposure matrix (2*2) [i] $fit +sex$ [o] scaled deviance = 218.48 (change = -14.80) at cycle 4 [o] d.f. = 2 (change = -1 ) [o] [i] $d e$ [o] estimate s.e. parameter [o] 1 -4.275 0.05997 1 [o] 2 -0.3344 0.08697 SEX(2) [o] scale parameter taken as 1.000 Females 278 = 19989 * exp[-4.275] RATE = exp[-4.275] = 0.0139 Males 252 = 25316 * exp [-4.275 - 0.3344] RATE = exp [-4.275 - 0.3344] = 0.0100 [i] $d r$ [o] unit observed fitted residual [o] 1 135 210.19 -5.186 [o] 2 74 161.28 -6.873 [o] 3 143 67.81 9.130 [o] 4 178 90.72 9.163
The log-rate model in GLIM: unsaturated modelOcc = Exp * exp[overall + sex + timing]
The log-rate model in TDAThe basic exponential model with time-constant covariates (Blossfeld and Rohwer, pp. 87ff) Occ = Exp * exp[overall + sex] SN Org Des Episodes Weighted Duration TS Min TF Max Excl ---------------------------------------------------------------------------- 1 0 0 53 53.00 128.47 0.00 144.00 - 1 0 1 530 530.00 72.63 0.00 140.00 - Sum 583 583.00 Number of episodes: 583 Successfully created new episode data. Idx SN Org Des MT Variable Coeff Error C/Error Signif ------------------------------------------------------------------- 1 1 0 1 A Constant -4.6098 0.0630 -73.1777 1.0000 2 1 0 1 A SEX1 0.3344 0.0870 3.8451 0.9999 Log likelihood (starting values): -2887.5967 Log likelihood (final estimates): -2880.1982 command file: ehd21.cf data file: test.dat (micro data)
LOG-RATE MODEL IN TDA: PROGRAMME # ehd2.cf Basic exponential model with covariate SEX nvar( dfile = test.dat, # data file ID = c1, # identification number SN = c2, # spell number TF = c3, # TIME LEAVING HOME (=ENDING TIME) # measured from age 0!!!! TF15 = TF-180, # measured from age 15 SEX = c4, # sex REASON = c5, # reason SEX1 = SEX[1], # see boek p. 61 SEX1 = 1 for females and 0 for males # MALES ref.cat SEX2 = SEX[2], # = 1 for females DES = if eq(REASON,4) then 0 else 1, # destination TFP = TF15, # Blossfeld: TF+1 !!!!!! ); edef( # define single episode data ts = 0, # starting time tf = TFP, # ending time org = 0, # origin state des = DES, # destination state ); # BASIC exponential model (Blossfeld-Rohwer p. 90-91) rate( xa (0,1) = SEX1, pres = ehd21.res, ) = 2;
Related models • Poisson distribution: counts have Poisson distribution (total number not fixed) • Poisson regression • Log-linear model: model of count data (log of counts) • Binomial and multinomial distributions: counts follow multinomial distribution (total number is fixed) • Logit model: model of proportions [and odds (log of odds)] • Logistic regression • Log-rate model: log-linear model with OFFSET (constant term) Parameters of these models are related
The unsaturated log-linear model • Assume: two-way classification; counts unknown but marginal totals given • Predict the expected counts (cell entries)
The unsaturated log-linear model as a log-rate model Odds ratio = 1
Updating a table: THE LOG-RATE MODEL IN TWO STEPS Odds ratio = 2.270837