Download
1 / 23
230 likes | 305 Views
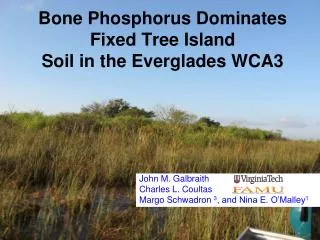
Bone Phosphorus Dominates Fixed Tree Island Soil in the Everglades WCA3. John M. Galbraith 1 , Charles L. Coultas 2 , Margo Schwadron 3 , and Nina E. O’Malley 1 1- Dept. of Crop and Soil Environmental Science, Virginia Tech, Blacksburg, VA

E N D
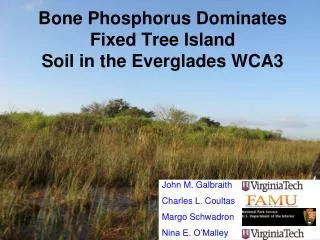
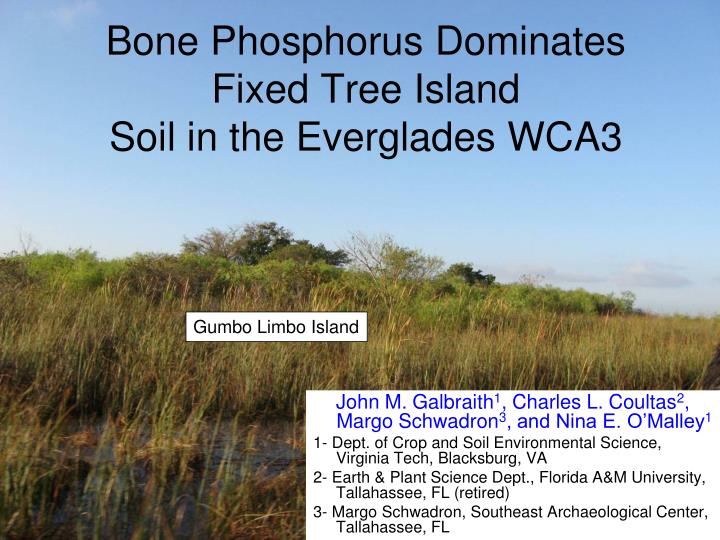
Bone Phosphorus Dominates Fixed Tree IslandSoil in the Everglades WCA3 John M. Galbraith1, Charles L. Coultas2, Margo Schwadron3, and Nina E. O’Malley1 1- Dept. of Crop and Soil Environmental Science, Virginia Tech, Blacksburg, VA 2- Earth & Plant Science Dept., Florida A&M University, Tallahassee, FL (retired) 3- Margo Schwadron, Southeast Archaeological Center, Tallahassee, FL Gumbo Limbo Island
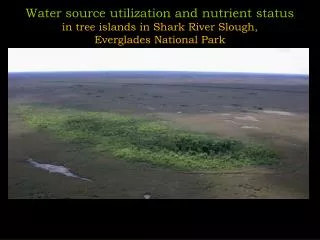
Fig. 1. A satellite view of Shark River Slough and adjoining ridge of the southern Everglades (Schwadron, 2006). Gumbo Limbo Island study site (red star).
Fixed Tree Island Soil P • The amount of phosphorus (P) in fixed tree island soils is higher than in the surrounding waters and subaqueous soils (Sklar and van der Valk, 2002). • Possible sources of P include: • Guano • Windblown particles • Bones in the soil • Upwelling groundwater
Sources of P (Wetzel, 2002) Our Hypotheses Trace P in Plant Litter containing P moves High P in bones is not mobile in soil, but is taken up by plants
Soil P on Gumbo Limbo Island • In 2009, we conducted a study of the soil properties on Gumbo Limbo Island in Water Conservation Area 3B along with the soil water, slough water, and guano. • The soil on the island summit is an alkaline kitchen midden soil (Petrocalcic Hapludoll) with abundant char and animal bones down to190 cm, with shells, charcoal, and limestone, a fluctuating water table below a shallow petrocalcic horizon, an apparent pre-habitation soil surface at 190 cm and limestone bedrock at 202 cm.
Soil Profile ^Au1 ^Au2 ^Au3 ^Bku ^Bkum ^BCku ^Cku1 Depth (cm) Horizon Name 0 to 5 ^Au1 5 to 18 ^Au2 18 to 26 ^Au3 26 to 47 ^Bku 47 to ~72 ^Bkum ~72 to 96 ^BCku 96 to 114 ^Cku1 114 to 156 ^Cku2 156 to 190 ^2Cku3 190 to 202 3Ab 202 + 4R Limestone 2,3,4 = different parent materials ^ = partially human-transported u = artifacts k = secondary carbonates m = continuously cemented b = former stable soil now buried
Soil Closeup Red and blackened bone and white shell fragments. Secondary CaCO3 is gray. Uncemented masses above the pen and cemented petrocalcic horizon below the pen. Wavy petrocalcic surface indicated by nail, knife, and pen. It formed in the soil during an extended period where evapo-transpiration exceeded precipitation ~2 to 4K Y.B.P. Roots stop at the top of the petrocalcic.
Hypotheses The breaking and burning of bones and animal parts by humans coupled with weathering of very small fragments releases high amounts of Ca and P where it is sequestered in-situ as secondary mineral precipitates of apatite (Ca5(PO4)3OH) (Graf, 2009) and calcite (CaCO3)in the high pH soil. Bones account for the P throughout the soil. Guano and dust are minor P contributors. Groundwater is a non-factor for P in the soil.
Methods • Soluble P was measured by ICP directly in soil and slough water and in bird guano droppings taken off plant leaves. Soil water was seen at 114 cm. • Total P was measured by HCl digestion in bulk unwashed soil (sieved to < 2 mm but not ground) and then in the water-washed sand-only fraction.
Results • Bones > 2 mm made up 4 to 44% by volume but decreased sharply in the horizon just above the limestone and in the subaqueous soil offshore. • Burned bones, char (ashes), shells, charcoal, and artifacts were found in all horizons down to 190 cm, supporting human habitation and human contribution to soil accumulation on the island head.
> 8mm Burned Bones, Snail, and Pottery in Horizon 2 Bones Vertebrae Land Snail Pottery
> 8 mm Bones, Snail, Gar Scales, and Cemented Soil in Horizon 7 Vertebrae Land Snail Gar Scales Bones CaCO3
Large Bones, Limestone, and Cemented Soil in Horizon 8 Limestone Bones CaCO3
Table 1. Particle Size Analysis Hor. Sand Silt Clay Gravel Modifier Texture Class Name % weight % vol. ------------ < 2mm ------------- > 2mm ^Au1 61 34 5 30 Gravelly Sandy Loam ^Au2 53 42 5 55 V. Grav. Sandy Loam ^Au3 56 39 5 20 Gravelly Sandy Loam ^Bku 48 47 5 33 Gravelly Sandy Loam ^Bkum 58 37 5 62 V. Grav. Sandy Loam ^BCku 59 36 5 30 Gravelly Sandy Loam ^Cku1 59 36 5 11 Sandy Loam ^Cku2 64 32 4 19 Gravelly Sandy Loam ^2Cku3 82 15 3 19 Gravelly Loamy Fine Sand 3Ab 34 31 35 5 Clay Loam 4R ---------------- LIMESTONE ------------------------------------------------------ The clay increase indicates weathering limestone bedrock when water tables were lower > 5,000 Y.B. P. or a subaqueous soil in deeper water. There were few bones and no artifacts in the lowest horizon. The gravel was mostly bones and shells, with some pottery and limestone.
Table 2. Carbon and CaCO3 Hor. TC - Inorg. C = Org. C est CaCO3 Name (calculated) -------------------------- % Soil < 2mm ------------------------- ^Au1 14.8 - 3.4 = 11.4 28 ^Au2 9.9 - 2.6 = 7.3 22 ^Au3 9.3 - 4.6 = 4.7 39 ^Bku 9.8 - 7.0 = 2.8 59 ^Bkum 5.5 - 4.1 = 1.4 34 ^BCku 3.9 - 4.9 = 0.0 41 ^Cku1 3.2 - 3.9 = 0.0 32 ^Cku2 4.0 - 3.6 = 0.4 30 ^2Cku3 3.9 - 3.2 = 0.6 27 3Ab 14.5 - 7.1 = 7.4 60 4R ----------------------------------------------------------------------- Soil pH ~8 throughout. TC (950ºC) did not burn large sand particles. CaCO3 by acid titration dissolved all sizes of particles.
Table 3. Other Nutrient Sources Ca K Mg P S --------------------- ppm ----------------------- Soil-Water 114 1 26 0.1 21 Open-Water 73 3 11 Tr 0.5 Guano 155 238 45 34 2301 Elements by direct ICP analysis, no extraction used (Mullins and Heckendorn, 2005).
cm depth % Wt. Sand-sized Bone 50 100 150 200 ^Au1 ^Au2 ^Au3 ^Bku ^Bkum ^BCku ^Cku1 ^Cku2 ^2Cku3 3Ab 4R Fluctuating Water Table 0 10 20 30 40 50 percent
cm depth Total P in individually-measured fractions 50 100 150 200 ^Au1 ^Au2 ^Au3 ^Bku ^Bkum ^BCku ^Cku1 ^Cku2 ^2Cku3 3Ab 4R % (wt) P in > 2 mm bones % (wt) P in < 2 mm soil Impervious Surface Petrocalcic Horizon Fluctuating Water Table 0 10 20 30 40 50 percent P
Soil P Distribution - 1 • Soil water percolates through the rooted surface layers and may perch above the petrocalcic where roots concentrate. Large soft masses of CaCO3 reinforce this concept. • Organic acids and rainwater cause weathering of bone and allow uptake of P by plants above the petrocalcic. Underneath the petrocalcic there are no roots for plant uptake.
Soil P Distribution - 2 • The alkaline soil water causes precipitation of weathered phosphorus as apatite and prevents movement of P in the soil in soluble forms. • Bone content explains total P distribution and content. P movement to island tails may occur as plant leaves take up P from the soil if leaf litter is moved to the tails by wind, water or animals. Guano and dustfall may contribute small amounts of P to island heads and tails.
P Source or Sink? Both? • The island soil is a large sink for P because it is a sink for bones brought in by humans and possibly animals. Now, only animals bring in bones. • The island soil is also a sink for guano P and windborne P, but they occur in trace amounts. • P in the upwelling groundwater is not a source because P is not mobile in the soil. Besides, the level of P in slough water is a trace amount. • The island plant leaf litter may be a source of P to island tails and nearby subaqueous soils.
Conclusions • Further investigation of petrocalcic horizon surface topography and extent along with a soil sampling transect study crossing across sloughs and island edges and tails are needed to further explain P dynamics. • P in bone fragments sufficiently explains the source, quantity and distribution of total phosphorus throughout the soil, although trace additions from the other sources are possible. • Soil testing combined with archaeological evidence have preserved a record of island-building, climate change, soil weathering and secondary mineral precipitation.
Acknowledgements • The South Florida Water Management District conducted some field work, provided air boat transportation, and funded the project. • Dr. Willie Harris at the University of Florida conducted some of the Total P lab analysis. • Doctoral candidate Maria-Theresa Graf conducted some field work and provided data, under direction of her advisor Dr. Gail Chmura of McGill University in Canada.